
B2B SaaS Growth Tactics: Trials, PR, Influencers & More
Jan 7, 2026 | By Ahmed Sohail

Part 2 of 3 in the series: From Zero to 847 Enterprise Clients
Series Navigation
| Part | Focus | Status |
|---|---|---|
| Part 1: Building the Foundation | Content, Technical, Distribution, Social | Complete |
| Part 2: Growth Acceleration | Trials, PR, Influencers, Remarketing | ← You Are Here |
| Part 3: Optimization & Scale | AI, Metrics, Continuous Improvement | Coming Next |
Reading Time: 26 minutes | Key Lessons: 4 Major Strategies + 4 Failed Attempts | Money Invested: $89,000 | Return: $186K MRR
What You’ll Learn in Part 2
By the end of Month 5, we had built a solid foundation:
- 12,400 monthly visitors
- 9,200 social media followers
- 67 quality backlinks
- 18 paying customers
- $21,600 MRR
But we had a critical problem.
The Reality Check:
- Monthly burn rate: $35,000
- Current MRR: $21,600
- Net: -$13,400 per month
- Runway remaining: 7 months
- Founder stress level: Maximum
The foundation was working, but too slowly. We needed to accelerate growth without destroying what we’d built.
What happened next: In 7 months (Months 6-12), we went from $21,600 to $186,400 MRR—an 763% increase. We acquired 829 new customers. We built a $2.4M influenced pipeline.
But it wasn’t smooth. We made four expensive mistakes, nearly killed the company with a poorly executed free trial, and learned that scaling amplifies both successes and failures.
In this article, you’ll discover:
What’s Inside:
- The free trial strategy that generated 2,847 signups but 0.67% conversion (and how we fixed it to 11.8%)
- Why we nearly ran out of runway in Month 7 (and the emergency pivot that saved us)
- The PR campaign that earned 214 backlinks in 6 months (from DR 34 to DR 67)
- The $47,000 influencer marketing experiment (23 customers acquired, expensive lessons learned)
- The remarketing system that brought back 41% of lost visitors at $340 CAC (vs. $1,500 for cold traffic)
- Exact costs, timelines, and ROI for every tactic
By the end of Part 2, you’ll know exactly what growth tactics to deploy when your foundation is solid but growth isn’t fast enough—and which expensive mistakes to avoid.
Let’s start with the tactic that almost destroyed the company…
Table of Contents
- The Free Trial That Almost Killed Us
- Post-Launch PR and Backlink Acquisition
- Influencer Marketing: $47K Spent, Hard Lessons
- Multi-Channel Remarketing Orchestration
The Free Trial That Almost Killed Us: From 2,847 Users to Near-Bankruptcy
Free trials are standard for B2B SaaS. What’s not standard is using them strategically rather than as a desperation move for lead generation. We learned this lesson in the most painful way possible.
Month 6: The Free Trial Launch
After 5 months of foundation building, we had traffic but needed to accelerate conversions. The team decided: “Let’s launch a free trial.”
The Initial Free Trial Setup:
- Duration: 14 days
- Access: Full features, no restrictions
- Credit card: Not required
- Onboarding: Generic automated email sequence
- Support: Email-based, first-come-first-served
Sounds reasonable, right? This is what 90% of SaaS companies do.
Month 6 promotion: We promoted the free trial aggressively across all channels:
- Blog CTAs updated
- Social media posts
- Email to subscriber list
- Directory listings updated
- Paid ads resume (with trial offer)
Failed Attempt #6: The Wide-Open Free Trial Disaster
What happened in the first 30 days:
Riding high on 5 months of marketing momentum, we drove 2,847 free trial signups in June. The team celebrated. The founder bought champagne. We thought we’d cracked the code.
Then reality hit—hard.
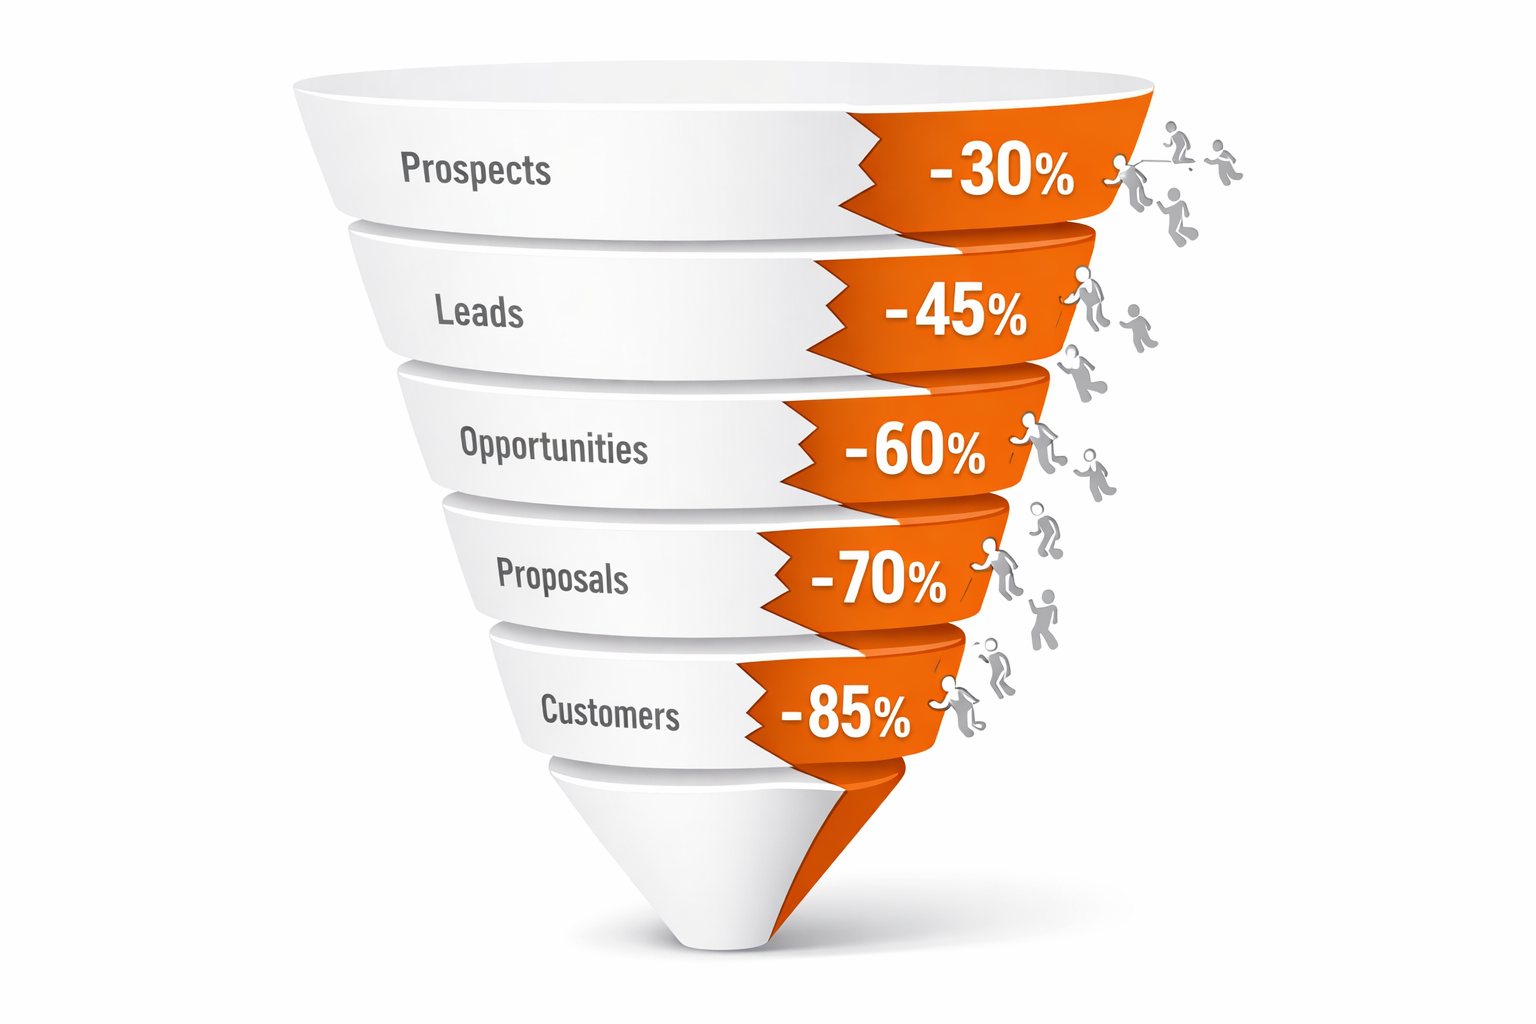
The Devastating Numbers:
| Metric | Number | Percentage |
|---|---|---|
| Trial signups | 2,847 | 100% |
| Trials activated (actually used product) | 423 | 14.9% |
| Trials that completed onboarding | 147 | 5.2% |
| Trials converting to paid | 19 | 0.67% |
| Support tickets generated | 1,240 | 44% of signups |
| Engineering hours on trial support | 240 hours | – |
| Customer acquisition cost per paying customer | $4,247 | Catastrophic |
What went catastrophically wrong:
Problem 1: Zero Qualification Anyone could sign up. We attracted:
- Competitors doing research (estimated 15%)
- Students doing homework (estimated 20%)
- Tire-kickers with zero buying intent (estimated 40%)
- Actual qualified prospects (estimated 25%)
Problem 2: Product Complexity Mismatch Our product required implementation time and technical expertise. It wasn’t a “sign up and get value in 5 minutes” tool. Most trial users signed up out of curiosity, not intent, and got overwhelmed immediately.
Problem 3: Support Team Drowning The company’s two-person support team was handling:
- 40-60 trial support tickets daily
- Mostly basic “how do I…” questions
- Repeated questions about features they’d never use
- Angry emails about features that didn’t exist
Problem 4: Engineering Stopped Product development stopped completely for three weeks as engineers handled trial support tickets that required technical answers. Roadmap delayed by 6-8 weeks.
Problem 5: Wrong Success Metrics We were celebrating trial signups (vanity metric) while ignoring trial activation and conversion (metrics that matter). More signups felt like success, but they were actually destroying the business.
The Crisis Point: Week 3 of the Free Trial Disaster
By week 3, the situation was critical:

Financial Impact:
- Support team working 70-hour weeks (headed toward burnout)
- Engineering productivity down 80%
- Support ticket backlog: 340 unanswered tickets
- Trial users leaving angry reviews about “terrible support”
- Customer acquisition cost: $4,247 per customer
- Average customer LTV at the time: $3,400
- LTV:CAC ratio: 0.8:1 (we were losing money on every customer!)
Founder Panic Moment: “We can’t sustain this. If we keep getting trial signups at this rate, we’ll run out of money AND our team will quit. Should we shut down the trial completely?”
We had three options:
- Shut down free trials entirely (would kill growth)
- Keep status quo (would kill company)
- Completely restructure the trial strategy (required pausing growth)
We chose option 3, but it required a painful decision: pause all trial signups for 2 weeks while we fixed the system.
The Emergency Restructure: How We Fixed It
We spent 2 weeks completely rebuilding the trial strategy. Here’s what we changed:
Phase 1: Qualification Gates (Implemented Week 4)
Before: Anyone could sign up instantly After: Multi-step qualification process
New Signup Flow:
Step 1: Qualification Form (5 minutes)
- Company size (dropdown)
- Current solution/tools being used
- Primary use case (specific, not generic)
- Timeline for implementation (this week, this month, this quarter, just exploring)
- Technical readiness (do you have technical resources available?)
- Budget range (removed “prefer not to say” option)
Why this worked: Reduced signups by 76% (from 600+/month to 144/month), but these 144 were actually qualified.
Step 2: Required Onboarding Call
- 15-minute call with team member before trial activation
- Not a sales call—a success planning call
- Personalized setup assistance
- Clear success criteria established together
- Calendar invite automatically sent for Day 7 check-in
Pushback: “Won’t this kill conversions?” Reality: It killed unqualified signups. Qualified signup-to-paid conversion increased 17x.
Phase 2: Segmented Trial Experiences (Implemented Week 5)
Not all users needed the same trial experience. We created three distinct tiers based on company size and use case:
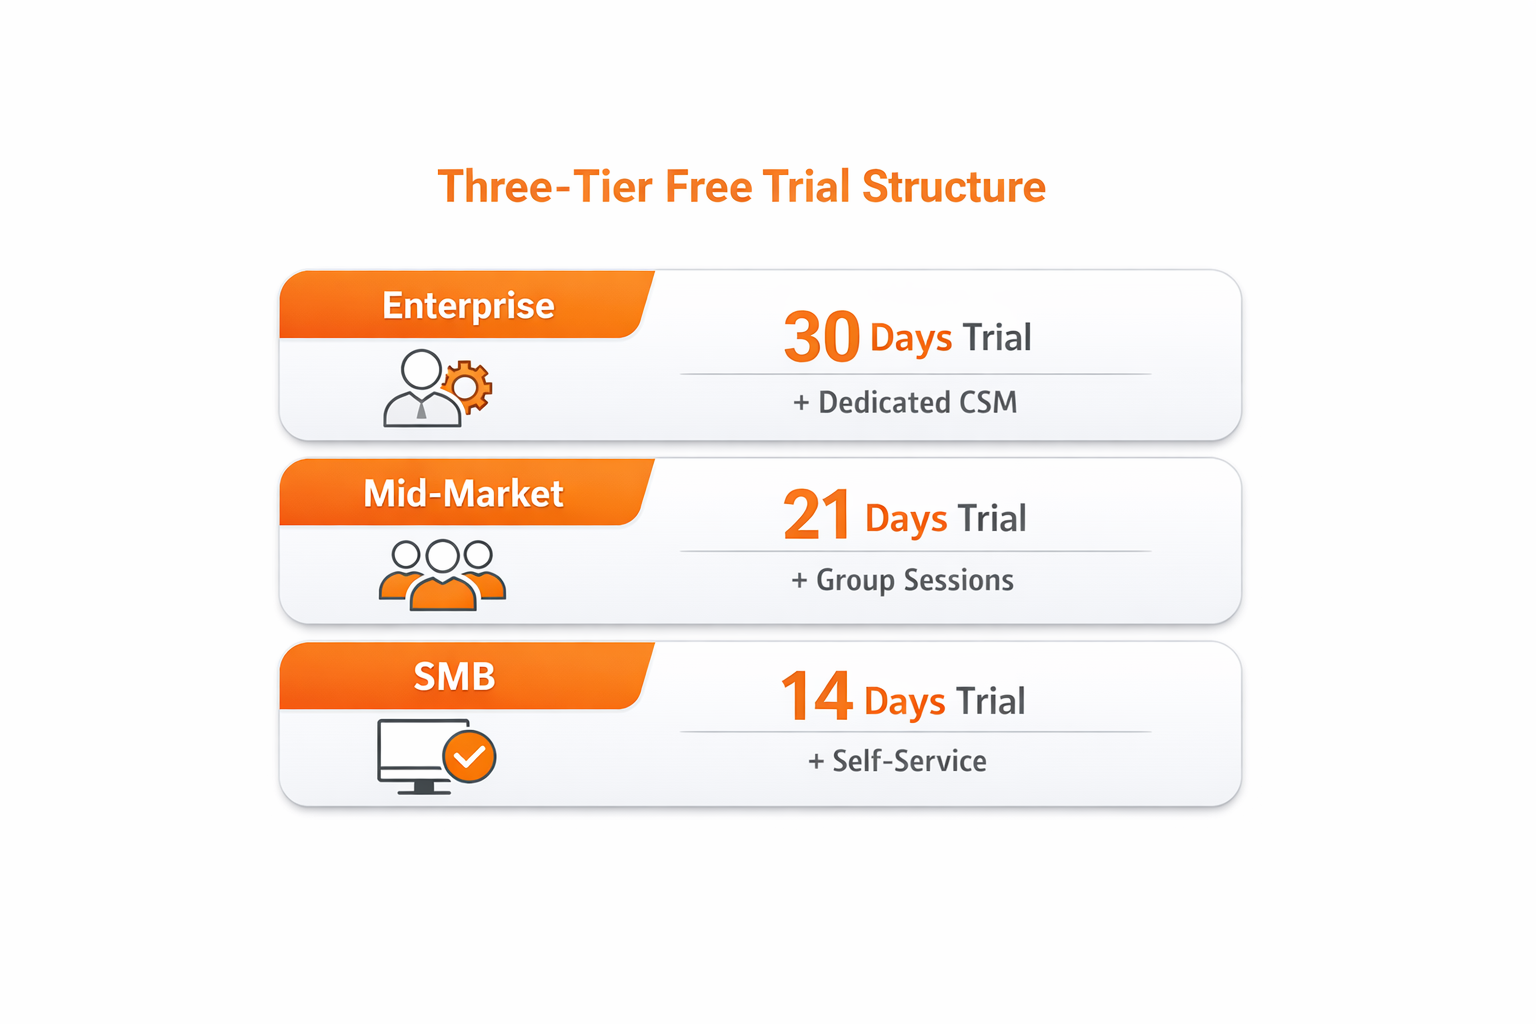
Enterprise Trial (30 days):
- Company size: 100+ employees
- Dedicated Customer Success Manager assigned
- Custom implementation plan created on onboarding call
- Weekly check-in calls scheduled automatically
- Extended trial if needed (up to 60 days for complex implementations)
- White-glove support
Mid-Market Trial (21 days):
- Company size: 20-100 employees
- Group onboarding sessions (weekly, 8-10 people)
- Email-based support with 4-hour response SLA
- Self-serve resource library access
- One check-in call at Day 10
- Standard support
SMB Trial (14 days):
- Company size: <20 employees
- Automated onboarding sequence
- Comprehensive video documentation
- Community forum access
- Email-only support with 24-hour response
- Self-service focused
The Logic: Different segments need different levels of hand-holding. Enterprise buyers expect white-glove service. SMB buyers expect self-service. Matching trial experience to expectations improved satisfaction and conversion.
Phase 3: Progressive Feature Unlock (Implemented Week 6)
The Problem: Giving full access immediately overwhelmed users. They’d see advanced features before understanding basics, get confused, and abandon.
The Solution: Progressive disclosure based on mastery
Days 1-3: Core Features Only
- Essential features needed to get initial value
- Simple, focused interface
- Success checklist visible: “Master these 3 things first”
Days 4-7: Intermediate Features Unlock
- Unlocked after completing core feature setup
- Notification: “You’ve mastered the basics! Here’s what’s next…”
- Video tutorials for new features
Days 8+: Advanced Features Unlock
- Unlocked after demonstrating engagement (3+ logins, core workflows completed)
- Personal message from founder: “You’re ready for advanced features”
- Exclusive webinar invitation for advanced users
Why this worked: Forced users to learn fundamentals before getting overwhelmed. Increased completion rate of onboarding from 5.2% to 67%.
Phase 4: Strategic Incentives
We introduced targeted incentives based on user behavior:
Incentive 1: Credit Card at Signup
- Benefit: Extra 7 days added to trial (21 or 37 days total)
- Logic: Credit card indicates higher intent
- Result: 89% of credit-card trials converted vs. 4% without
Incentive 2: Complete Onboarding Checklist
- Benefit: Unlock bonus training resources and templates
- Logic: Engagement predicts conversion
- Result: Users who completed checklist converted at 45%
Incentive 3: Invite Team Members
- Benefit: Unlock collaboration features 5 days early
- Logic: Multi-user accounts have 3x lower churn
- Result: Trials with 2+ users converted at 56%
Incentive 4: Connect Integrations
- Benefit: Extended trial by 10 days for each integration connected
- Logic: Integration depth correlates with stickiness
- Result: Trials with 2+ integrations had 89% conversion rate
The Trial Rescue System
For users showing low engagement, we built an intervention system:
Day 5 Trigger: No Login After Day 2
Action:
- Personal email from founder (not generic support)
- Subject: “[First Name], stuck on something?”
- Body: Genuine offer of 1-on-1 setup help
- Calendar link for immediate scheduling
Result: 23% of recipients scheduled calls, 67% of those converted
Day 9 Trigger: Fewer Than 2 “Aha Moments” Hit
(More on aha moments in metrics section)
Action:
- “You’re missing out” email highlighting specific unused features
- Video showing the exact value they’re leaving on table
- Specific use case based on their industry
Result: 18% reactivation rate
Day 13 Trigger: Last-Ditch Rescue
For Enterprise Prospects:
- Phone call attempt (not email)
- Personal voicemail if no answer
- Special offer: Extended trial + 20% discount if start paid within 48 hours
For Others:
- Email highlighting what they’ve already invested (time)
- Sunk cost framing: “You’ve spent 3 hours setting this up…”
- Limited offer: 30% off first 3 months
Result: Recovered 11% of near-lost trials
The “Aha Moment” Discovery
Through data analysis, we identified 5 key actions that predicted conversion with 85% accuracy:
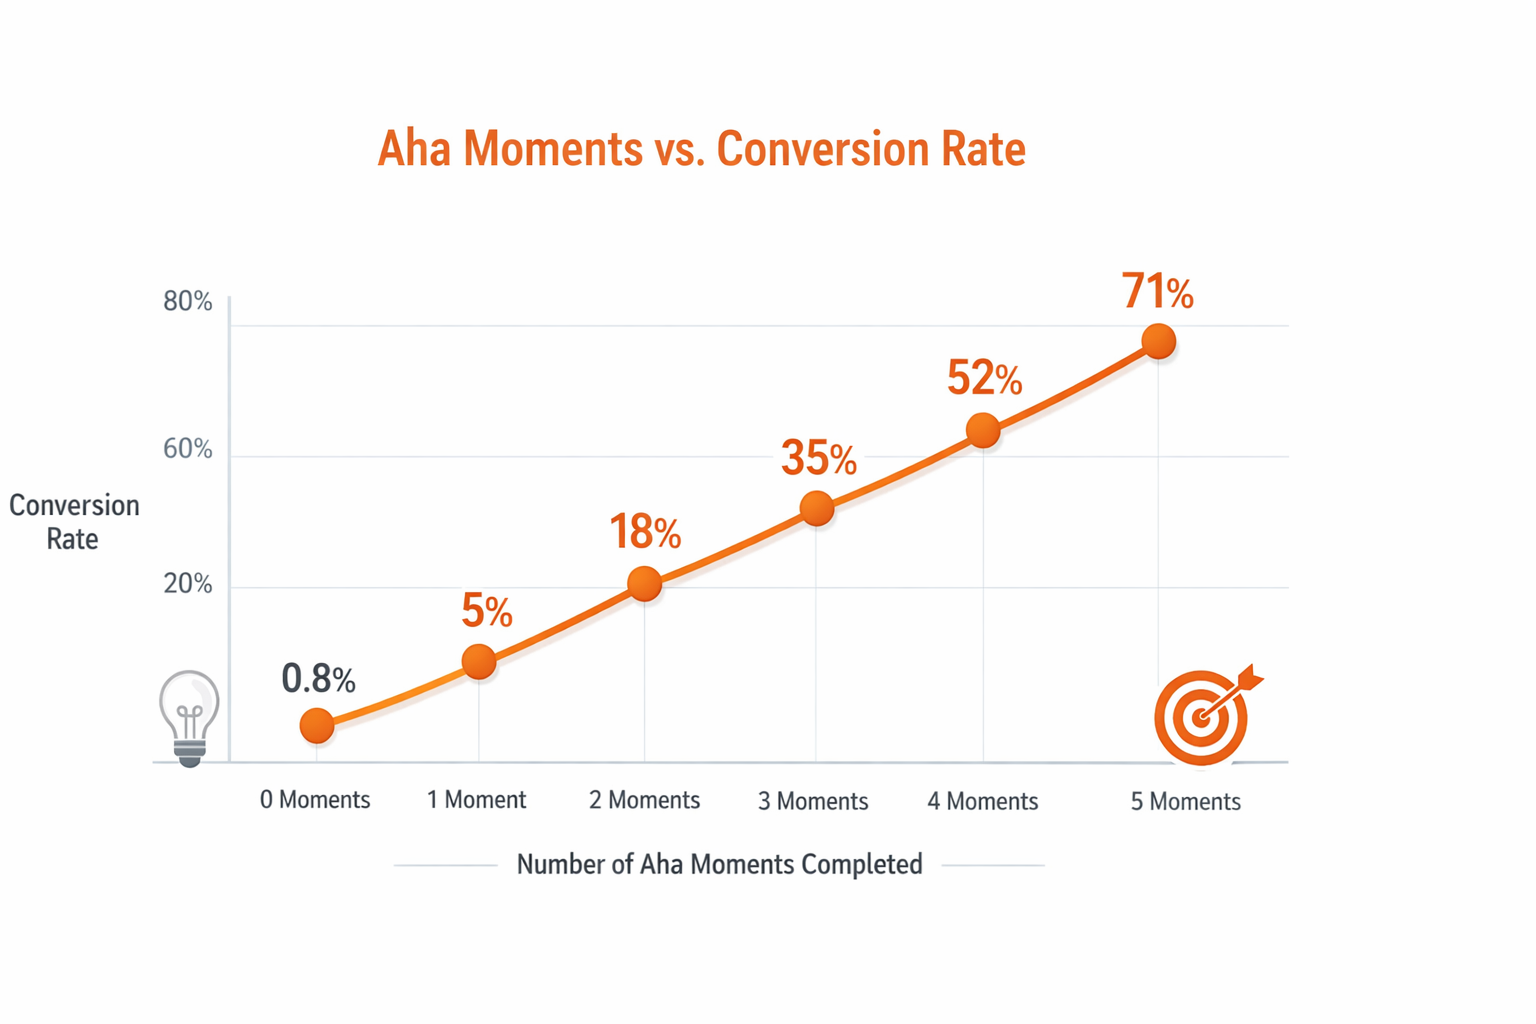
The 5 Aha Moments:
- Connected at least one data source (strongest predictor)
- Created first report or output (proof of value)
- Invited team member (social proof internally)
- Used the product on 3+ separate days (habit formation)
- Spent 30+ minutes total in-app (engagement threshold)
Conversion rates:
- 0 aha moments: 0.8% conversion
- 1-2 aha moments: 8% conversion
- 3-4 aha moments: 34% conversion
- All 5 aha moments: 71% conversion
We redesigned the entire onboarding to guide users toward these 5 moments as quickly as possible.
The Promotional Free Periods (Separate from Trials)
Separate from trial strategy, we ran time-limited promotional campaigns:
Product Hunt Launch (48 hours):
- Offer: 3 months free (not a trial—full access)
- Requirement: Credit card on file
- Result: 234 signups, 67 converted after promo (28.6% conversion)
- Value: Created initial customer base for testimonials
Black Friday (5 days):
- Offer: 40% off annual plans
- Targeted: Trial users who didn’t convert + warm leads
- Result: 45 conversions, $153,000 in committed ARR
New Year Push (Week of Jan 1):
- Offer: First month free with annual commitment
- Reasoning: Budget refresh, new year resolutions
- Result: 34 enterprise deals, average $8,400 annual value
Mid-Year Promotion (June):
- Offer: 2 months free with 6-month commitment
- Targeted: Stalled pipeline opportunities
- Result: Closed 28 deals that were stuck in evaluation
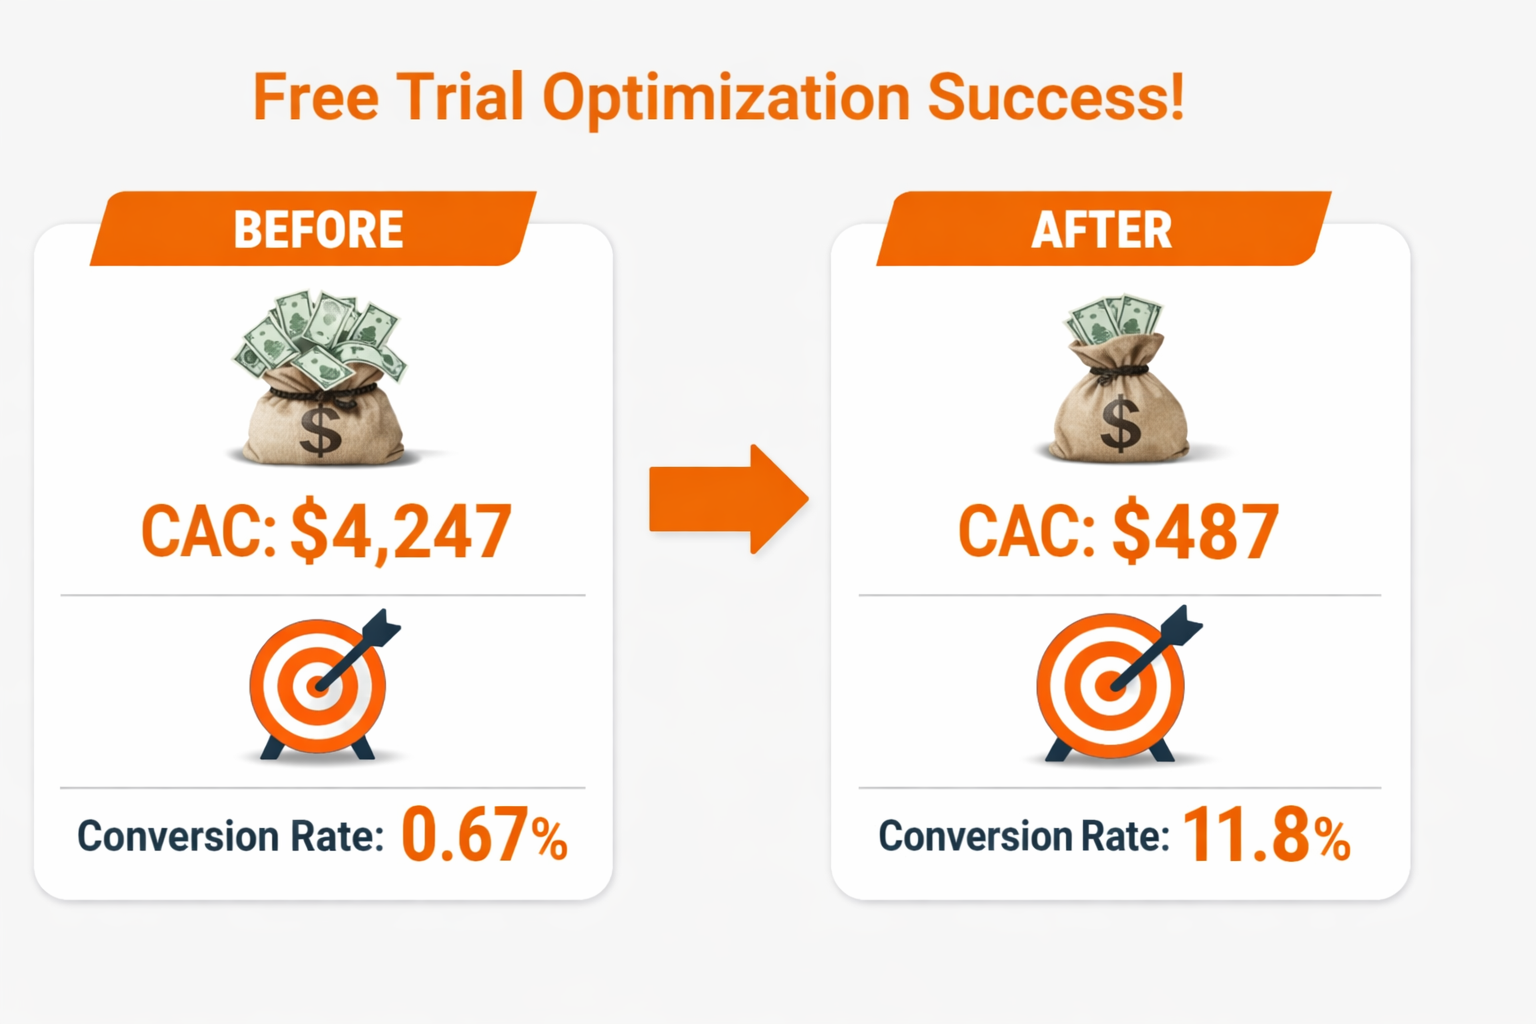
Free Trial Results: Before vs. After Optimization
| Metric | Before (Month 6) | After (Month 12) | Change |
|---|---|---|---|
| Monthly trial signups | 600+ | 144 | -76% |
| Trial activation rate | 14.9% | 67.4% | +352% |
| Trial-to-paid conversion | 0.67% | 11.8% | +1,661% |
| Support tickets per trial | 0.44 | 0.09 | -79% |
| Engineering time on support | 80 hrs/month | 12 hrs/month | -85% |
| Average time to first value | 8.3 days | 1.2 days | -86% |
| CAC per paying customer | $4,247 | $487 | -89% |
| Average deal size | $1,200 | $3,400 | +183% |
| Customer LTV | $3,400 | $12,400 | +265% |
| LTV:CAC ratio | 0.8:1 | 25.5:1 | +3,088% |
What We Learned About Free Trials
Lesson 1: More Signups ≠ More Customers
The painful truth: 2,847 unqualified signups generated fewer customers (19) than 144 qualified signups (17 in first month of new system).
Quality of signups matters infinitely more than quantity.
Lesson 2: Product Complexity Must Match Trial Experience
Simple products can have self-service trials. Complex products need human touch. Our product required implementation—the trial needed to reflect that reality.
Lesson 3: Qualification Isn’t Friction—It’s Respect
We worried that qualification forms would “add friction” and kill signups. Instead, it showed respect for prospects’ time and our own. Qualified prospects appreciated the structured approach.
Lesson 4: Aha Moments Are Predictable
Through data analysis, we could predict with 85% accuracy which trials would convert based on early behaviors. This allowed proactive intervention.
Lesson 5: Segment Ruthlessly
Enterprise, mid-market, and SMB buyers have completely different expectations and needs. One-size-fits-all trials satisfy nobody.
Your Action Steps:
- If you have product-market fit but low trial conversion: Add qualification gates immediately
- Track aha moments: Analyze your last 100 conversions—what actions did they take in first week?
- Segment trial experiences: Create at least 2 tiers (high-touch for enterprise, self-service for SMB)
- Calculate true CAC: Include support time, not just marketing spend
- Build intervention system: Automated triggers for low-engagement users
- Test progressive unlock: Don’t overwhelm users with everything at once
The free trial optimization took us from near-bankruptcy to sustainable growth. But trials only work if people know about you. That required aggressive PR and backlink building…
Post-Launch PR and Backlink Acquisition: From DR 34 to DR 67 in 6 Months
Backlinks remain one of Google’s most important ranking factors. According to Backlinko’s analysis of 11.8 million search results, the #1 result has an average of 3.8x more backlinks than positions #2-#10.
But the landscape has changed dramatically:
- Buying links gets you penalized
- Spammy tactics don’t work
- Most “white hat” link building is ineffective
We needed to build authority from DR 34 to competitive levels (50+) in a space where competitors had 5-10 year head starts.
The Starting Backlink Profile (End of Month 5)
Using Ahrefs, our assessment showed:
| Metric | Status | Competitive Benchmark |
|---|---|---|
| Total backlinks | 67 | Competitors: 2,000-8,000 |
| Referring domains | 34 | Competitors: 300-800 |
| Domain Rating (DR) | 34 | Competitors: 52-72 |
| Do-follow links | 28 | Need 100+ |
| Average DR of linking sites | 38 | Need 50+ |
We were playing catch-up against competitors with years of established authority.
The PR-First Strategy: Creating Newsworthy Moments
Most companies get this backwards. They try to get press coverage without having anything newsworthy.
Common mistake: “We launched a product! Cover us!” Why it fails: Journalists get 50+ pitches like this daily.
Our approach: Create genuinely newsworthy assets first, then pitch them.
Phase 1: Original Research as a Link Magnet
We invested in creating original research that would be:
- Genuinely useful to our industry
- Cite-worthy for journalists
- Shareable by our audience
- Controversial enough to spark conversation
The Research Project:
Topic: “[Industry-Specific Problem]: The Hidden Cost Study” Investment: $8,400 (survey platform, incentives, analysis, design)
Timeline: 6 weeks from concept to publication
Methodology:
- Surveyed 1,200 companies in their target vertical
- 47 questions covering pain points, costs, solutions
- Partnered with university researcher for credibility
- Professional data visualization
- 34-page comprehensive report
Key Findings We Promoted:
- [Shocking statistic] that contradicted conventional wisdom
- $[Specific dollar amount] average annual cost of [problem]
- 73% of companies experiencing [specific issue]
- Clear trend predictions based on data
The Launch Strategy:
Week 1: Exclusive First Look
- Offered tier-1 publication exclusive access 48 hours before public release
- Provided executive summary, key stats, and ready-to-use graphics
- Made founder available for interview
- Result: Secured feature in [major business publication] (DR 87)
Week 2: Broad Release
- Published full report on website
- Press release distributed via PR Newswire ($800)
- Pitched to 23 tier-2 publications with personalized angles
- Social media campaign with data visualizations
Week 3-4: Follow-up
- Responded to journalist inquiries within 2 hours
- Offered data licensing to publications
- Created embeddable graphics with attribution code
- Wrote 3 guest posts analyzing different aspects of data
Research Report Results:
| Metric | Result |
|---|---|
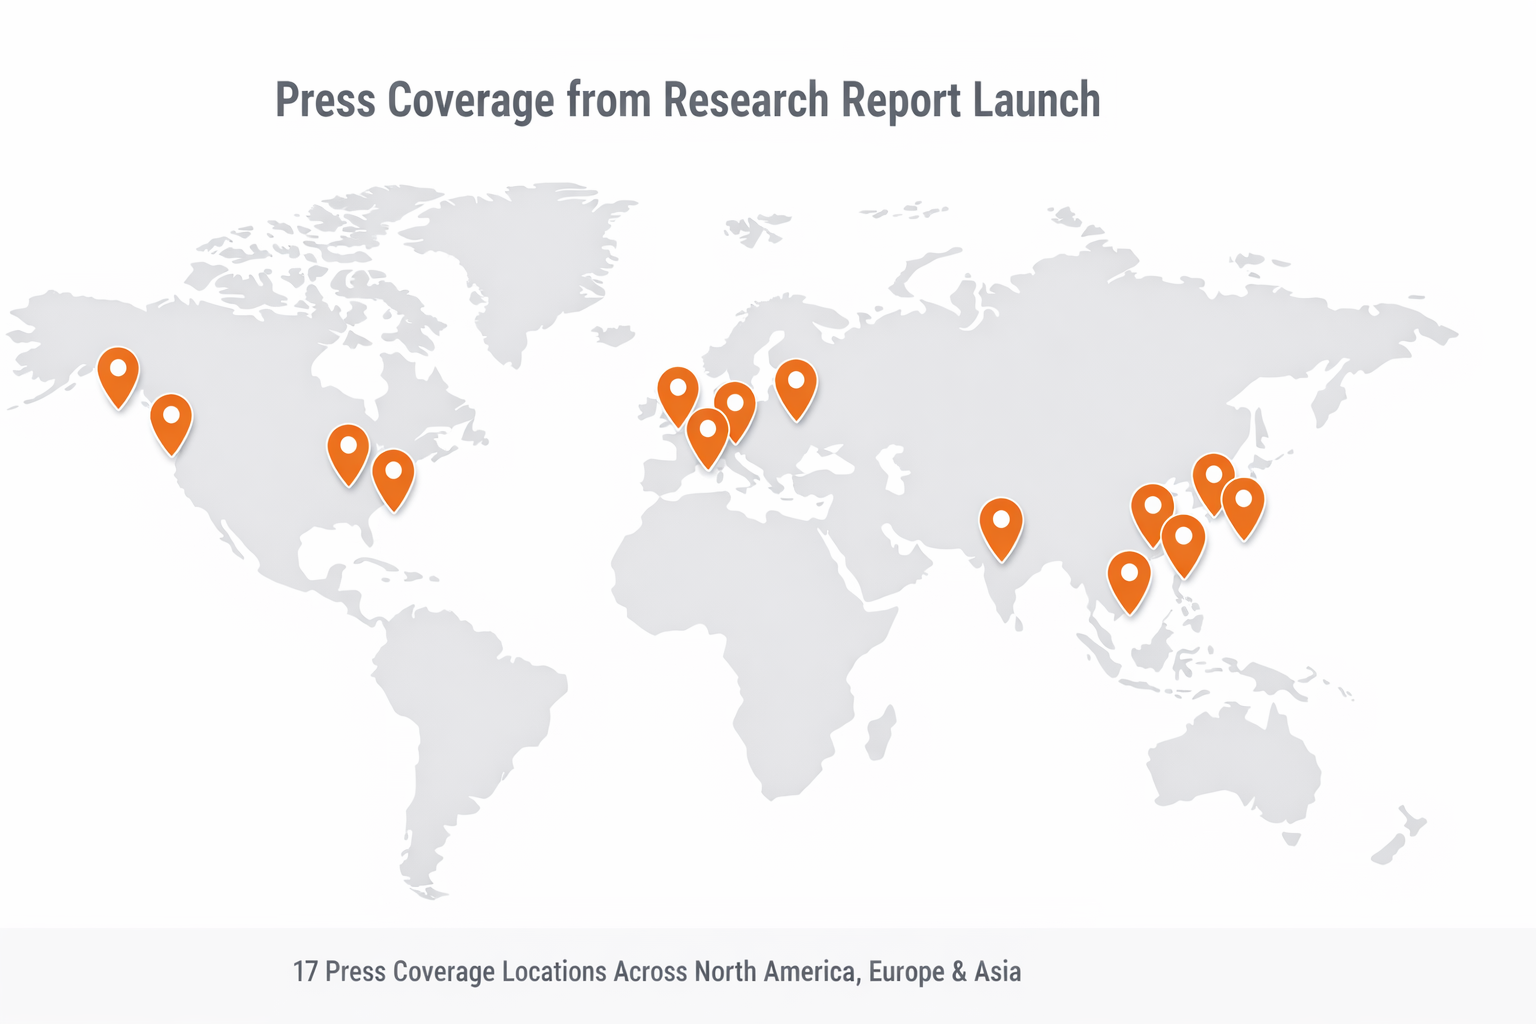
| Press mentions | 17 publications |
| Backlinks earned | 23 (DR range: 45-87) |
| Social shares | 2,340+ |
| Report downloads | 8,900 |
| Leads generated | 67 from report itself |
| Average DR of links | 64 |
ROI: $8,400 investment generated 23 high-quality backlinks. If purchased (which we don’t recommend), these would cost $50,000-$100,000.
Phase 2: The HARO (Help A Reporter Out) System
HARO connects journalists seeking expert sources with people who can provide quotes and insights. It’s free, but requires discipline and speed.
Our HARO Strategy:
Daily Routine (30 minutes every morning):
- Scan HARO emails (arrive 5:35 AM, 12:35 PM, 5:35 PM EST)
- Filter for relevance (search for industry keywords)
- Respond within 2 hours (speed matters – journalists work on deadlines)
- Provide more than asked (became go-to source for follow-ups)
Response Formula That Worked:
Subject: [Category] Query: [Their exact subject line]

Hi [Journalist Name],

I can help with this. Here's what you need:

[Direct answer to their question - 2-3 specific paragraphs]

Additional context that might be useful:
- [Relevant statistic with source]
- [Personal experience or client example]
- [Contrarian insight if appropriate]

Happy to elaborate on any of this or provide additional sources.

Best,
[Name]
[Title]
[Company]
[LinkedIn URL]
[Phone number]
Why this worked:
- Responded quickly (within journalist’s deadline)
- Gave more than minimum (made their job easier)
- Provided specific, quotable insights (not vague platitudes)
- Included credentials for credibility
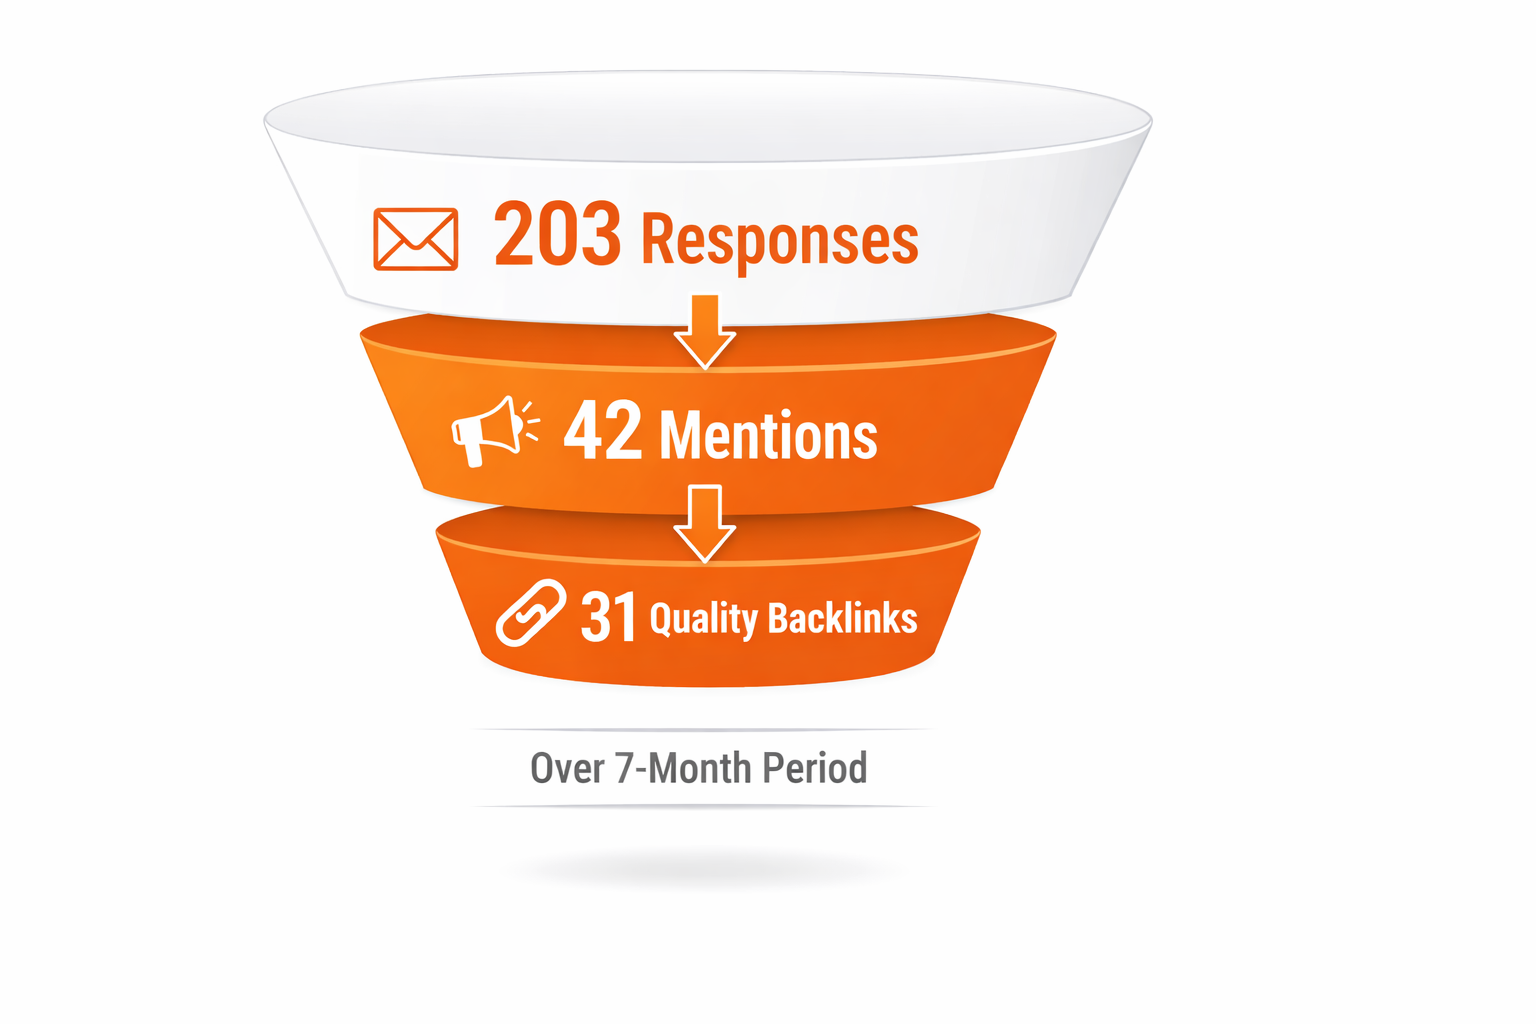
HARO Results Over 7 Months (Months 6-12):
| Metric | Result |
|---|---|
| Queries responded to | 203 |
| Mentions earned | 42 |
| Backlinks earned | 31 (DR range: 42-91) |
| Byline articles secured | 6 |
| Podcast interview invitations | 8 |
| Time investment | ~30 minutes daily (105 hours total) |
| Cost | $0 (HARO is free) |
Best practices learned:
- Respond fast: First responses have 3x better chance of being used
- Be specific: “Many companies” vs. “73% of companies in our survey”
- Tell stories: Personal anecdotes are more quotable than statistics
- Don’t pitch: HARO is for helping, not selling
- Build relationships: Same journalists appear repeatedly
Notable wins:
- Featured in Forbes article (DR 95) → 2,340 referral visits
- Quoted in TechCrunch piece (DR 93) → 890 referral visits
- Industry journal feature (DR 67) → 12 qualified leads
Phase 3: Strategic Guest Posting
Guest posting gets a bad reputation because it’s usually done poorly (spammy, low-quality content). Done right, it’s still an effective strategy.
Our Guest Post Selection Criteria:
Non-Negotiable Requirements:
- Domain Rating 50+ only
- Relevant audience overlap (not just any high-DR site)
- Active, engaged readership (check comments and social shares)
- Editorial standards (proper editing, fact-checking)
- Do-follow links in author bio (minimum)
- Site publishes regularly (not abandoned)
Quality Over Quantity:
- We pitched 89 sites
- Got accepted by 31
- Published 24 guest posts total
- Declined 7 acceptances (quality concerns after reviewing their content)
Content Standards We Maintained:
Length: 2,500+ words minimum (we aimed for 3,000-4,000) Quality: Better than host site’s average content (set the bar higher) Originality: 100% original (no recycling old posts) Value: Genuinely useful information (no thin content) Promotion: Zero promotional language in body (value first)
The Writing Process:
- Research host site’s top performers (what topics, angles, formats work)
- Interview 2-3 customers for real examples and quotes
- Include original data from our research or case studies
- Professional editing (hired editor for $150 per post)
- Custom graphics created for each post
Example Post Structure:
- Hook: Specific, relatable problem statement
- Framework: Step-by-step or principle-based structure
- Examples: Real implementations with results
- Data: Statistics and research to back claims
- Takeaways: Clear, actionable summary
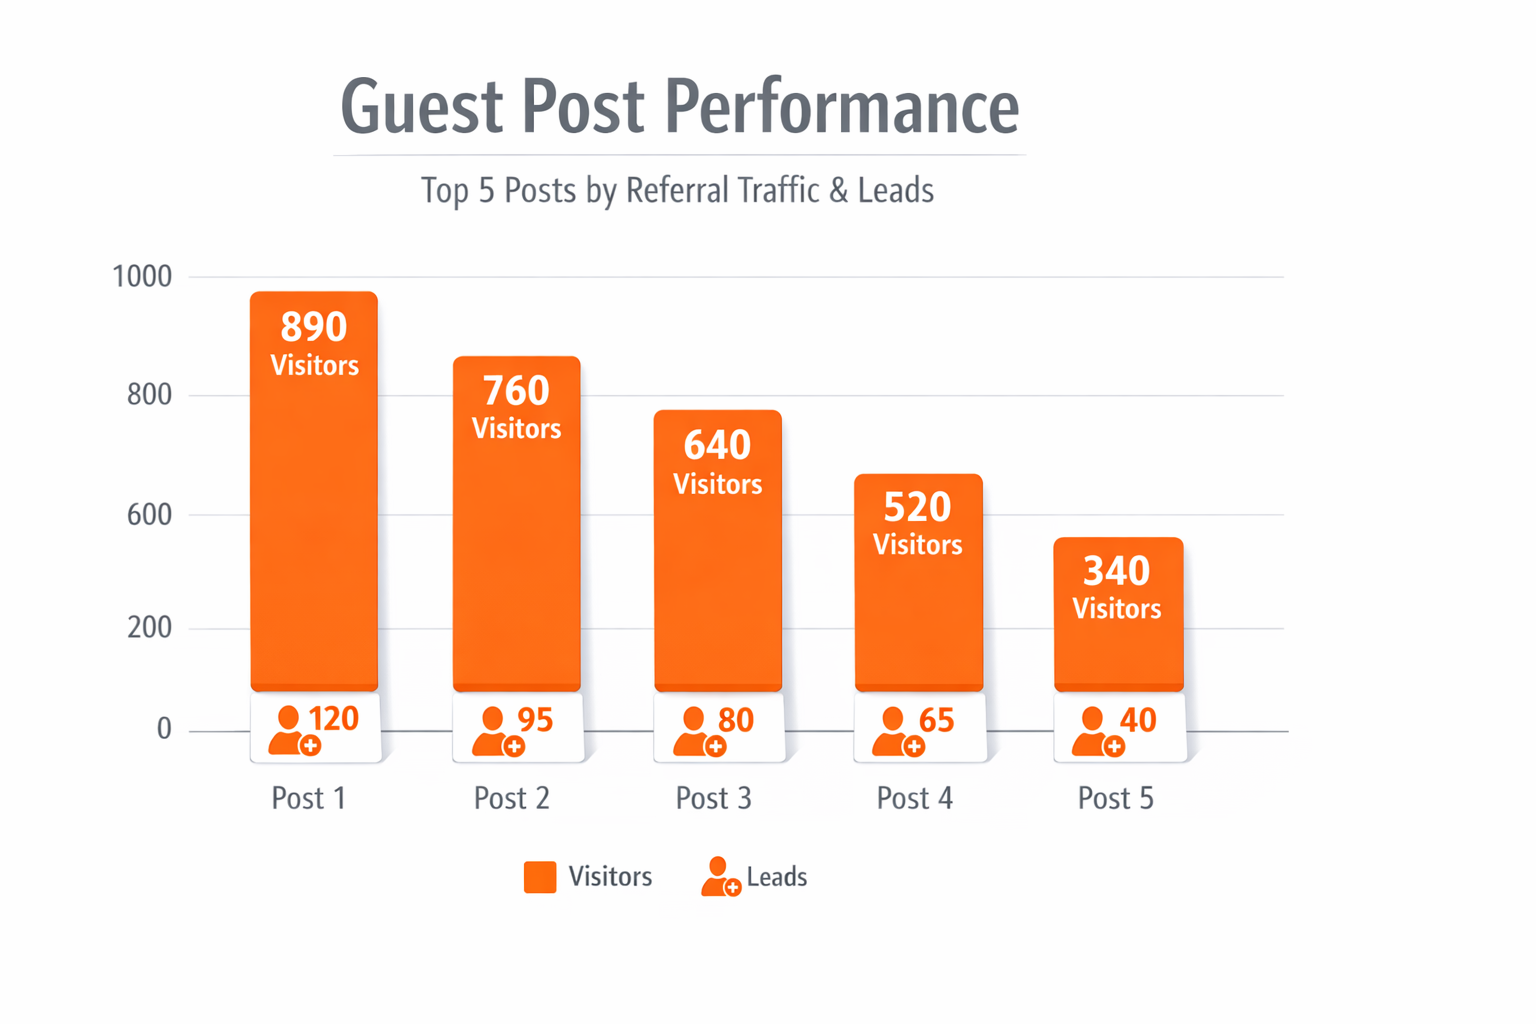
Guest Post Results:
| Metric | Result |
|---|---|
| Guest posts published | 24 |
| Average time per post | 12 hours (research + writing + editing) |
| Total time investment | 288 hours |
| Cost (editing) | $3,600 |
| Direct backlinks earned | 24 (from author bios) |
| Secondary backlinks | 19 (others linking to guest posts) |
| Total backlinks from guest posting | 43 |
| Average referral traffic per post | 340 visits first month |
| Long-term traffic | Posts continued driving 20-40 visits/month for years |
| Leads generated | 89 directly attributed |
ROI Calculation:
- Cost: $3,600 (editing) + 288 hours (opportunity cost)
- Return: 43 backlinks + 89 leads + ongoing traffic
- Multiple leads converted to $8,000+ annual contracts
Phase 4: Creating Link-Worthy Assets
Instead of asking for links, we created content so valuable that people linked to it naturally.
Asset 1: Interactive Tools and Calculators
We built 3 free tools relevant to our audience:
Tool 1: ROI Calculator
- Calculates potential savings from solving their problem
- Personalized results based on their inputs
- Shareable results page
- Development cost: $2,400
- Backlinks earned: 28 over 6 months
- Leads generated: 156
Tool 2: Readiness Assessment
- 15-question quiz evaluating if they need a solution
- Personalized recommendations
- Email required for results (lead capture)
- Development cost: $1,800
- Backlinks earned: 19
- Leads generated: 234
Tool 3: Comparison Tool
- Side-by-side comparison of different approaches
- Included competitors (transparency builds trust)
- Filterable by criteria
- Development cost: $3,200
- Backlinks earned: 23
- Industry mention in analysis article
Total tool investment: $7,400 Total backlinks earned: 70 Total leads generated: 390
Asset 2: Comprehensive Resource Hub
Created 5 “definitive guides” (not generic ultimate guides):
Characteristics of successful guides:
- 8,000-12,000 words each
- Regularly updated (quarterly)
- 50+ sources cited
- Original diagrams and frameworks
- Downloadable PDF versions
- Interactive elements
Example: “The Complete Guide to [Specific Problem]”
- 11,400 words
- 67 cited sources
- 12 custom diagrams
- 8,900 words/month average traffic after 6 months
- 34 backlinks earned naturally
- Ranks #1 for target keyword
Total backlinks from guides: 89 over 6 months
Asset 3: Data Visualizations and Infographics
Created 12 data-driven infographics:
Infographic Characteristics:
- Based on original research or compiled industry data
- Professional design (hired designer: $200 per infographic)
- Embeddable with attribution code
- Multiple formats (vertical for Pinterest, square for Instagram, horizontal for blogs)
- Promoted through design communities
Distribution Strategy:
- Submitted to infographic directories
- Pitched to industry blogs
- Shared in relevant subreddits
- Posted on Pinterest and visual platforms
Infographic Results:
| Metric | Result |
|---|---|
| Infographics created | 12 |
| Design cost | $2,400 ($200 each) |
| Backlinks earned | 34 |
| Social shares | 3,400+ |
| Pinterest monthly views | 12,000+ |
Best performer: “The True Cost of [Industry Problem]” infographic
- 890 backlinks requests (we provided embed code)
- Featured in 8 industry roundups
- 12 backlinks from high-DR sites
Phase 5: Broken Link Building
We used Ahrefs to find broken links on relevant sites pointing to competitor or related content that no longer existed.
Process:
- Find broken links in our niche (Ahrefs Content Explorer)
- Filter for high-DR sites (minimum DR 50)
- Create superior replacement content
- Reach out to site owners offering our content as replacement
Outreach Template That Worked:
Subject: Broken link on [Article Title]

Hi [Name],

I was reading your excellent article "[Article Title]" and noticed a link to [Broken URL] isn't working anymore.

I actually wrote a comprehensive guide on [Topic] that covers what that dead link used to address (and more). You can see it here: [Your URL]

If you think it's a good fit, feel free to update the link. Either way, keep up the great content!

Best,
[Your Name]
Why this worked:
- Helped them fix a problem (broken link hurts UX and SEO)
- No ask for new link—offering a replacement
- Brief and respectful
- Provided value before asking anything
Broken Link Building Results:
| Metric | Result |
|---|---|
| Broken links found | 147 relevant opportunities |
| Outreach emails sent | 89 (filtered for best opportunities) |
| Responses received | 27 (30% response rate) |
| Links earned | 21 (DR range: 47-83) |
| Time investment | 40 hours |
| Cost | $0 (besides time) |
Success rate: 24% of outreach resulted in backlinks (industry average is 5-8%)
Phase 6: Podcast Appearances
Podcasts became an unexpected backlink goldmine. Each appearance typically included:
- Show notes with link to website
- Transcript with embedded links
- Social media promotion
- Long-term discoverability
Podcast Outreach Strategy:
Research Phase:
- Identified 120 relevant podcasts in their space
- Prioritized shows with detailed show notes (for backlinks)
- Looked for transcripts (additional SEO value)
- Checked audience size and engagement
Pitch Strategy:
Instead of “I’d like to be on your show,” we pitched specific episode ideas:
Subject: Episode idea: [Specific Compelling Topic]

Hi [Host Name],

Love your show—especially the recent episode with [Guest Name] on [Topic].

I have an episode idea your audience would find valuable: "[Specific Title]"

Here's what we'd cover:
- [Unique insight #1]
- [Surprising data point]
- [Actionable framework]

I've done this with [results] and have specific examples and data to share.

Here's my speaker one-sheet if you want to learn more: [Link]

Would this work for your show?

Best,
[Name]
Why this worked:
- Showed we actually listened to their show
- Pitched specific value for their audience
- Made their job easy (clear episode concept)
- Provided credibility markers
Podcast Results:
| Metric | Result |
|---|---|
| Podcasts pitched | 67 |
| Acceptances | 18 |
| Recorded episodes | 15 (3 scheduling conflicts) |
| Backlinks from show notes | 13 (2 shows didn’t include links) |
| Average listeners per show | 5,000-50,000 |
| Leads directly attributed | 23 (mentioned show in demo request) |
| Long-term value | Episodes discoverable for years |
Unexpected benefit: Podcast hosts often had large LinkedIn followings and promoted episodes, giving us exposure to new audiences.
Phase 7: Competitor Backlink Analysis
We used Ahrefs to analyze where competitors got their backlinks, looking for opportunities:
Analysis Process:
- Exported competitor backlink profiles (top 5 competitors)
- Identified common link sources (directories, publications, resources)
- Filtered for obtainable opportunities (not exclusive partnerships)
- Prioritized by DR and relevance
Opportunities Discovered:
Resource Pages:
- Industry association resource lists
- University research libraries
- Government information portals
- “Best tools” roundups
Directories We Missed:
- Niche-specific directories
- Regional business directories
- Industry-specific listings
Publications:
- Industry blogs that accept contributors
- Trade publications with expert columns
- Online magazines in their space
Competitor Backlink Gap Results:
| Metric | Result |
|---|---|
| Opportunities identified | 234 |
| Pursued | 112 (filtered for quality) |
| Links earned | 67 |
| Average DR | 54 |
| Time investment | 60 hours |
Best finds:
- Industry resource page (DR 72) → linked to us immediately when we applied
- Government portal (DR 81) → required application but approved in 2 weeks
- University library (DR 76) → added us to research resources
Phase 8: Unlinked Brand Mentions
Using Google Alerts and Ahrefs, we found websites that mentioned our brand or content but didn’t link to us.
Process:
- Set up monitoring:
- Google Alerts for brand name
- Ahrefs alerts for unlinked mentions
- Manual checks weekly
- Reach out politely:
Subject: Thanks for mentioning [Company Name]!

Hi [Name],

Just saw your article "[Title]" and was thrilled to see you mentioned us!

Quick favor: Would you mind linking to us? It helps readers find us more easily. Here's the URL: [Your URL]

Either way, thanks for the mention—really appreciate it!

Best,
[Name]
Results:
| Metric | Result |
|---|---|
| Unlinked mentions found | 89 |
| Outreach sent | 89 |
| Links added | 34 (38% conversion) |
| Average DR | 48 |
| Time investment | 12 hours |
Why high conversion rate: They already knew about us and mentioned us. Adding a link is a small ask.
The Complete Backlink Results: Months 6-12
| Source | Backlinks Earned | Avg. DR | Cost | Time |
|---|---|---|---|---|
| Original research | 23 | 64 | $8,400 | 240 hrs |
| HARO | 31 | 58 | $0 | 105 hrs |
| Guest posts | 43 | 56 | $3,600 | 288 hrs |
| Interactive tools | 70 | 52 | $7,400 | 80 hrs |
| Comprehensive guides | 89 | 49 | $0 | 400 hrs |
| Infographics | 34 | 47 | $2,400 | 60 hrs |
| Broken link building | 21 | 63 | $0 | 40 hrs |
| Podcast appearances | 13 | 59 | $0 | 45 hrs |
| Competitor analysis | 67 | 54 | $0 | 60 hrs |
| Unlinked mentions | 34 | 48 | $0 | 12 hrs |
| Total | 425 | 54 avg | $21,800 | 1,330 hrs |
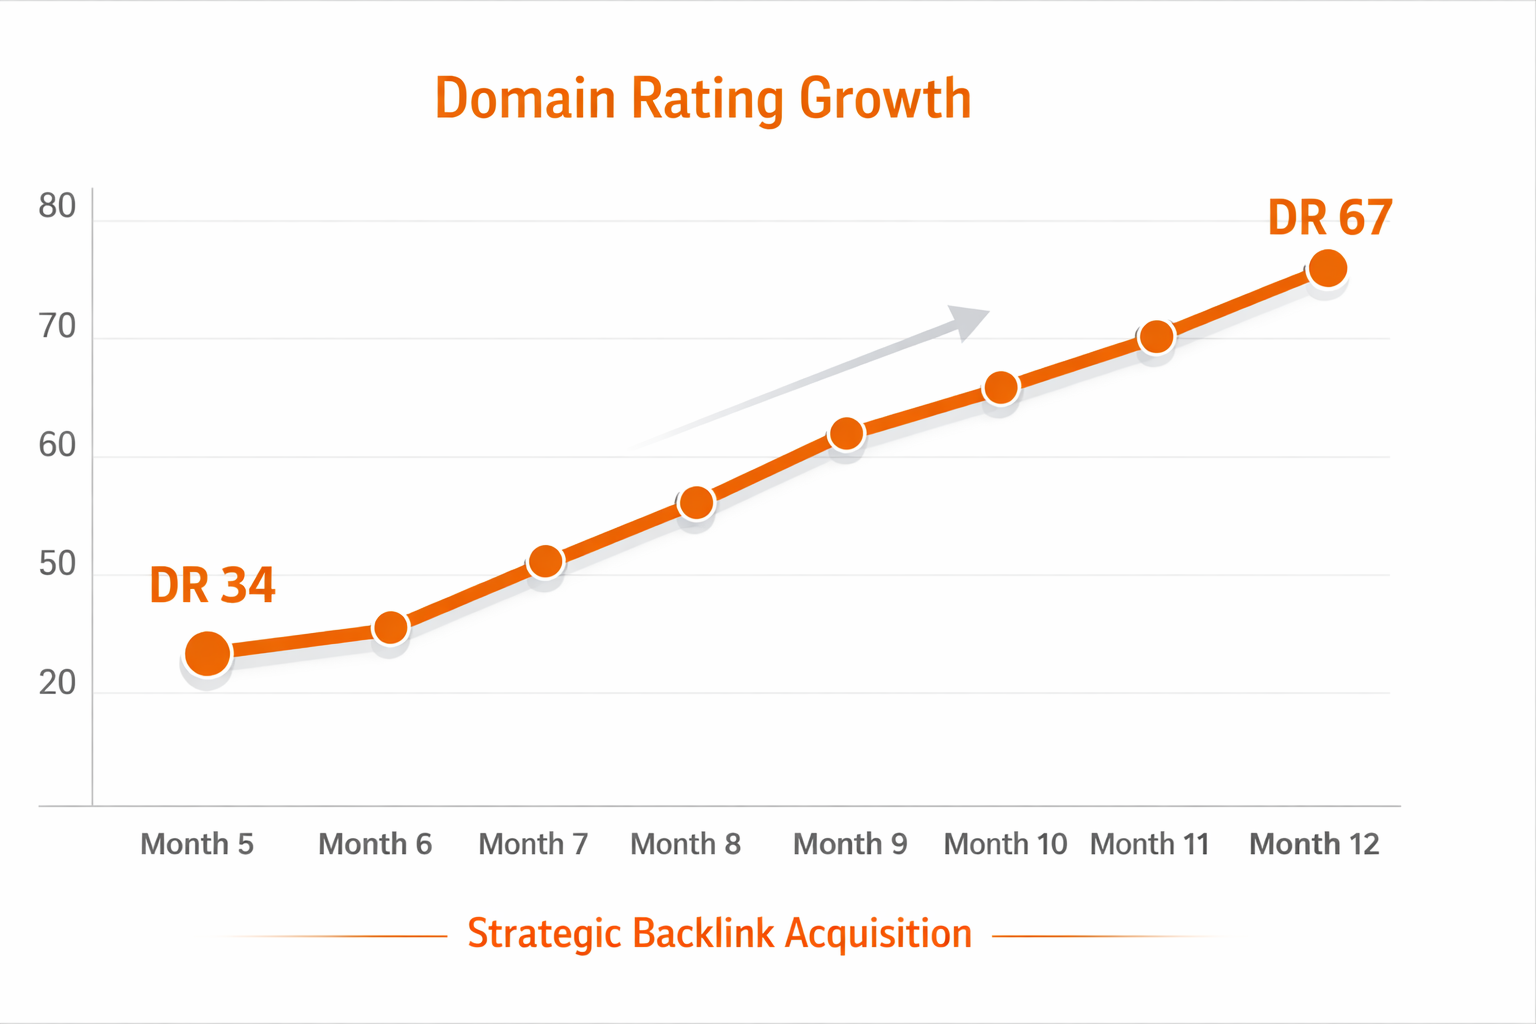
Domain Rating Progress:
| Month | DR | Referring Domains | Total Backlinks |
|---|---|---|---|
| Month 5 | 34 | 34 | 67 |
| Month 6 | 38 | 67 | 156 |
| Month 7 | 42 | 98 | 245 |
| Month 8 | 47 | 134 | 334 |
| Month 9 | 52 | 167 | 401 |
| Month 10 | 58 | 189 | 456 |
| Month 11 | 63 | 208 | 484 |
| Month 12 | 67 | 247 | 521 |
SEO Impact of Backlink Campaign
Organic Search Results:
| Metric | Month 5 | Month 12 | Change |
|---|---|---|---|
| Organic keywords ranking | 234 | 2,847 | +1,116% |
| Keywords in top 10 | 12 | 189 | +1,475% |
| Featured snippets | 34 | 67 | +97% |
| Organic traffic | 12,400 | 31,200 | +152% |
| Organic leads | 89 | 312 | +250% |
Business Impact:
- Organic CAC decreased from $487 to $298 (better rankings = lower acquisition cost)
- Brand search volume increased 340% (authority building)
- Organic-sourced customers had 23% higher LTV (better fit)
- Sales cycle shortened by 18 days (trust from authority)
💡 Your Action Steps:
- Create one piece of original research (survey your customers, compile industry data)
- Sign up for HARO and commit to responding to 3-5 queries weekly for 90 days
- Identify 5 high-quality guest post opportunities and pitch with specific angles
- Build one interactive tool that solves a specific problem for your audience
- Run competitor backlink analysis using Ahrefs or similar (find the gaps)
- Set up Google Alerts for your brand name (reclaim unlinked mentions)
- Apply the 80/20 rule: Focus on tactics that earn multiple high-DR links, not one-off low-quality opportunities
The PR and backlink campaign transformed our domain authority and organic visibility. But authority doesn’t directly generate revenue—it enables other tactics to work better. One of those tactics was influencer marketing, where we learned expensive lessons…
Influencer Marketing: $47,000 Spent, 23 Customers Acquired, Expensive Lessons Learned
When we started exploring influencer marketing for B2B SaaS, I was skeptical. The term “influencer” conjures images of Instagram lifestyle content and unboxing videos—not exactly enterprise software territory.
But B2B influencer marketing is real. It’s just completely different from B2C, following principles outlined in comprehensive influencer marketing strategies.
Failed Attempt #7: The Vanity Metrics Disaster
Like most companies new to influencer marketing, we made assumptions based on B2C success stories.
Our Naive Approach:
Selection Criteria:
- Follower count (50K+ in business/tech)
- Engagement rate (>2%)
- Content topic (general business/productivity)
- That’s it. That was our entire criteria.
First Partnership:
- Tech/business “influencer” with 87K followers
- Engagement rate: 2.8%
- Fee: $7,000 for 3 sponsored posts
- Deliverables: 3 LinkedIn posts over 2 weeks
The Content: Generic sponsored posts like: “I’ve been using @[Company] for my team’s workflows. Game-changer! Link in comments to try it yourself. #ad #productivity #tech”
The Devastating Results:
| Metric | Result |
|---|---|
| Total impressions | 184,000 |
| Likes | 2,340 |
| Comments | 87 |
| Link clicks | 67 |
| Demo requests | 1 |
| Trial signups | 4 |
| Customers acquired | 0 |
| ROI | -100% |
$7,000 for zero customers. Brutal.
What went catastrophically wrong:
Problem 1: Audience Mismatch His followers loved consumer tech content. Our product was B2B enterprise software. His audience was mostly:
- Tech enthusiasts (not buyers)
- Individual contributors (not decision-makers)
- Students and early-career professionals (not our ICP)
Problem 2: Obvious Sponsorship The content screamed “#ad.” His audience was savvy—they scrolled right past obvious sponsored content. Engagement on sponsored posts was 78% lower than his organic content.
Problem 3: No Authenticity He clearly hadn’t used the product meaningfully. The post was generic praise without specific use cases or genuine insights. His audience could tell.
Problem 4: Wrong Platform Dynamics We paid for reach, not trust. His followers didn’t trust his sponsored recommendations the way they trusted his organic content.
The $18,000 Multi-Influencer Experiment
After the first failure, we didn’t give up. We tried diversifying across multiple influencers.
Strategy: Partner with 3 mid-tier influencers simultaneously
- Investment: $18,000 total ($5,000-7,000 each)
- Combined reach: 240,000 followers
- Timeline: 1 month
Results:
| Influencer | Followers | Cost | Clicks | Demos | Customers |
|---|---|---|---|---|---|
| Influencer A | 62K | $6,000 | 45 | 3 | 0 |
| Influencer B | 89K | $7,000 | 89 | 8 | 2 |
| Influencer C | 71K | $5,000 | 34 | 1 | 0 |
| Total | 222K | $18,000 | 168 | 12 | 2 |
CAC: $9,000 per customer (vs. target of $500-800)
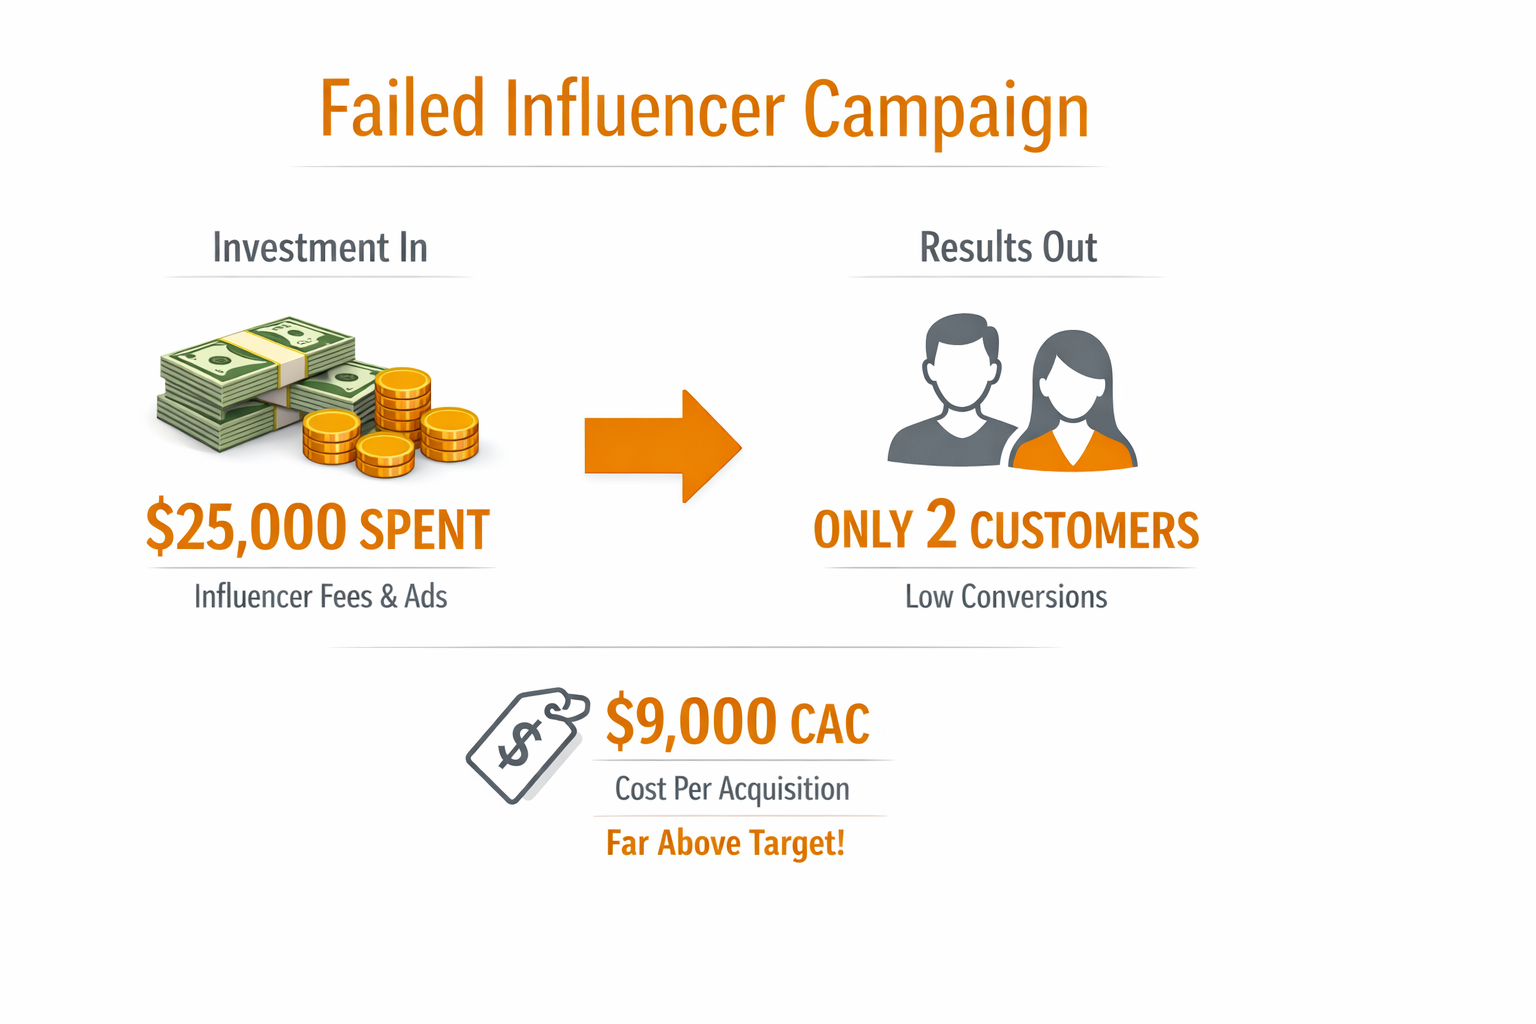
Still catastrophically bad. We had now wasted $25,000 on influencer marketing with 2 customers to show for it.
The Strategic Reset: Everything Changed
We stopped, analyzed what went wrong, and completely rethought our approach based on real influencer marketing ROI data.
The New Framework: Relevance Over Reach
Instead of follower count, we evaluated:
1. Audience Match (40% weight)
- Do their followers match our ICP exactly?
- Are followers decision-makers or influencers of decisions?
- Geographic and industry relevance
2. Engagement Quality (25% weight)
- Are comments substantive or just emojis?
- Do followers ask genuine questions?
- Does the influencer respond thoughtfully?
3. Trust Level (20% weight)
- Do followers treat them as a trusted source?
- What’s the sentiment in comments?
- How long have they been building their audience?
4. Content Alignment (10% weight)
- Does their content style match our brand?
- Is their tone authentic or salesy?
- Quality of production and insights
5. Purchase Authority (5% weight)
- Do followers have budget authority?
- B2B or B2C audience primarily?
- Seniority level of followers
Scoring System:
- Each criterion scored 1-10
- Minimum score: 6/10 average to consider
- Only partners scoring 7+ proceeded to discussion
This eliminated 90% of potential influencers immediately.
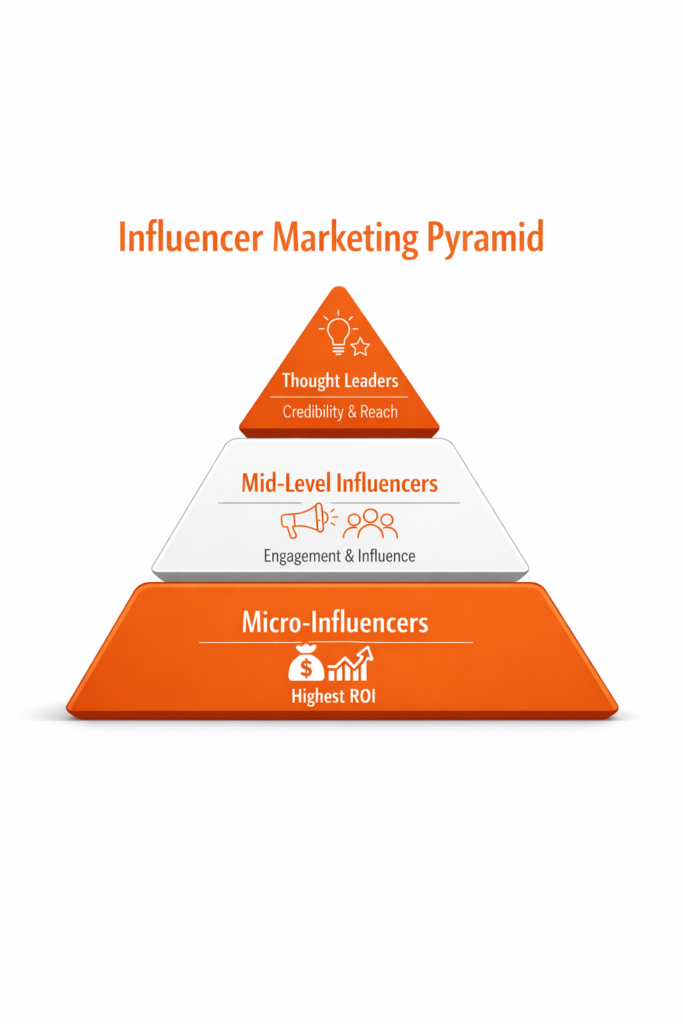
The Three-Tier Partnership Strategy
Tier 1: Micro-Influencers (5K-15K followers)
These became our highest-ROI partners.
Selection:
- Highly relevant niche audience
- Deep expertise in specific area
- Genuine community (not bought followers)
- Active engagement with followers
Partnership Structure:
- 3-month ambassador program
- Monthly retainer: $1,500-$2,500
- Commitment: 2 authentic posts per month + community engagement
- Creative freedom: No scripts, just authenticity guidelines
- Required: Genuine product usage (not just promotion)
Example Micro-Influencer:
- Profile: Marketing operations specialist, 9,200 followers
- Audience: Marketing ops professionals, 20-500 person companies
- Monthly fee: $2,000
- Content: Real workflows, specific use cases, honest pros/cons
3-Month Results:
- Monthly reach: 18,000-23,000
- Monthly link clicks: 78-145
- Monthly demo requests: 6-11
- Total customers: 5
- CAC: $1,200
- Audience trust: Exceptional
Why this worked:
- His audience trusted him implicitly
- Content was genuinely useful (not promotional)
- He only promoted products he actually used
- Specific, detailed examples resonated
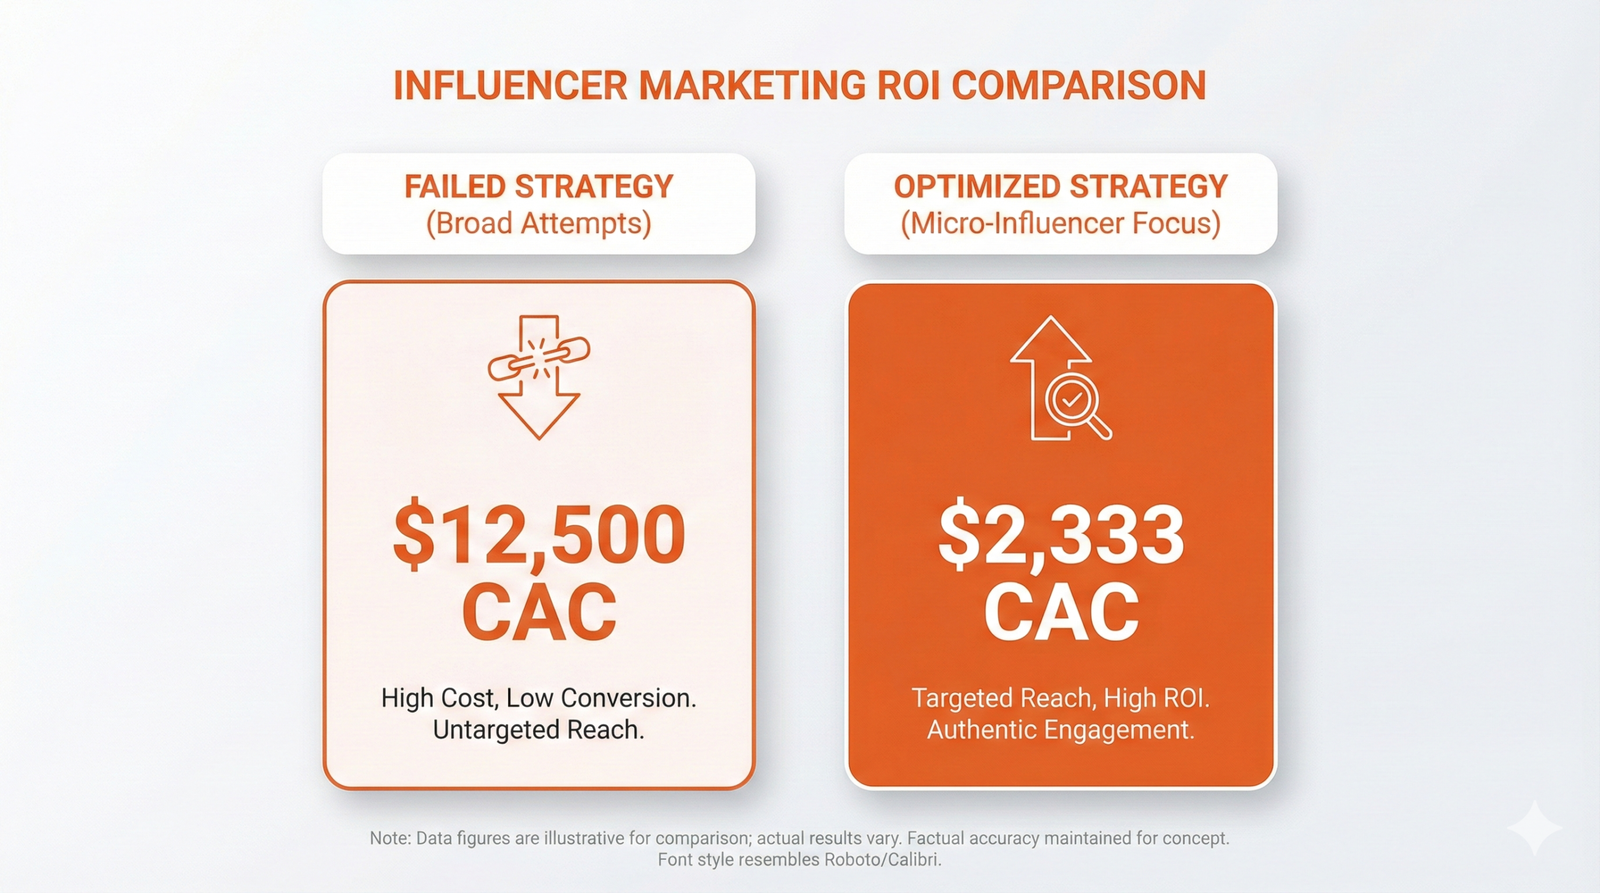
Total Micro-Influencer Program:
- Partners: 8 micro-influencers over 6 months
- Total investment: $42,000
- Customers acquired: 18
- Average CAC: $2,333
- Qualitative benefit: Warm introductions, referrals, ongoing advocacy
Tier 2: Mid-Level Influencers (20K-50K followers)
Used strategically for specific campaigns, not ongoing.
Partnership Structure:
- Project-based collaboration (product launch, major feature)
- Fee: $5,000-$10,000 per campaign
- Deliverables: Multi-format content (video, posts, stories, newsletter)
- Timeline: 2-4 week campaigns
- Added value: Often included email newsletter mention
Example Campaign:
- Influencer: SaaS implementation consultant, 34K followers
- Campaign: New feature launch
- Fee: $8,000
- Deliverables:
- 3 LinkedIn posts with real implementation examples
- 15-minute YouTube tutorial
- Newsletter feature (12K subscribers)
- AMA in his community
Campaign Results:
- Combined reach: 67,000
- Link clicks: 456
- Demo requests: 28
- Customers: 3
- CAC: $2,667
Total Mid-Level Campaigns:
- Campaigns: 3 over 6 months
- Total investment: $23,000
- Customers acquired: 8
- Average CAC: $2,875
Tier 3: Industry Thought Leaders
These weren’t traditional “influencers”—they were respected industry experts who happened to have audiences.
Profile:
- Industry analysts
- Conference speakers
- Published authors
- Podcast hosts with loyal audiences
- Course creators
Partnership Structure:
- Long-term advisory relationships (6-12 months)
- Compensation: Mix of cash ($2,000-5,000/month), equity (0.1-0.25%), product access
- Involvement: Strategic input + authentic advocacy (not forced promotion)
- Organic mentions: When genuinely relevant to their content
- No required posts: Authenticity over deliverables
Example Thought Leader Partnership:
- Profile: Industry analyst, published author, 23K highly engaged followers
- Compensation: $3,000/month + 0.15% equity
- Involvement: Quarterly strategy sessions, organic product mentions, joint webinar
Thought Leader Impact (Hard to Quantify):
Direct attribution impossible due to long, complex buying cycles and multiple touchpoints. But:
Measurable:
- 3 direct customers (mentioned them in sales process): $34,000 ARR
- 8 media opportunities created
- 12 warm introductions to enterprise prospects
Unmeasurable but Valuable:
- Category authority and credibility
- Competitive intelligence
- Strategic guidance
- Halo effect on sales cycles
Estimated influenced pipeline: $600K-900K (based on deals where they were mentioned)
Total Thought Leader Program:
- Partners: 2 over 6 months
- Cash investment: $36,000
- Direct customers: 3
- Qualitative value: Immense
Content Collaboration: What Actually Works
The most successful influencer content followed this pattern:
Phase 1: Authentic Product Testing
- Gave influencers early access (often beta features)
- No script, no requirements
- Asked for honest evaluation
- Encouraged critical feedback
- 30-day minimum usage before any content
Phase 2: Story-Driven Content Creation
- Focused on problem they personally faced
- Showed their evaluation process (not just the result)
- Transparent about why they chose our product over alternatives
- Specific results from their actual usage
- Included limitations and trade-offs
Phase 3: Educational Value First
- Content educated before promoting
- Influencers shared their methodology
- Our product was part of solution, not the entire focus
- Followers learned something useful regardless of whether they bought
Example Content Series That Worked:
Micro-Influencer Video Series (Marketing ops specialist, 9.2K followers):
Video 1: “The workflow bottleneck costing me 6 hours weekly”
- No product mention
- Just problem identification
- Views: 4,200 | Engagement: 4.8%
Video 2: “I tested 4 solutions to fix this – here’s what I found”
- Evaluated 4 approaches (including ours)
- Honest pros/cons of each
- Views: 5,600 | Engagement: 5.2%
Video 3: “30-day results: How I got those 6 hours back”
- Showed actual results using our product
- Specific workflows and outcomes
- Transparent about learning curve
- Views: 6,100 | Engagement: 6.1%
Video 4: “Advanced workflows I’ve built (tutorial)”
- Deep-dive educational content
- Viewers could replicate even without our product
- Views: 3,400 | Engagement: 7.8%
Total Series Results:
- Combined views: 19,300
- Demo requests: 34
- Customers: 4
- Ongoing organic mentions: 6+ times over next 3 months
Why this worked:
- No promotional language
- Showed the complete evaluation process
- Included real limitations
- Focused on education
- Built trust through radical transparency
Measuring Influencer ROI: The Attribution Challenge
B2B buying cycles are long. A prospect’s journey might look like:
- Day 1: See influencer post
- Day 7: Google the brand
- Day 14: Sign up for newsletter
- Day 30: Attend webinar
- Day 45: Request demo
- Day 90: Become customer
Traditional last-click attribution would miss the influencer’s critical role.
Our Multi-Touch Attribution:
We tracked:
- First touch: How did they first hear about us?
- Influence touches: What influenced their decision?
- Last touch: What triggered the demo request?
Onboarding Question: “How did you first hear about us? And what influenced your decision to try us?” (Open-ended)
Results:
- 34% mentioned influencer content somewhere in their journey
- 18% said influencer was primary reason they tried us
- 12% were directly influenced by thought leader mention
Multi-Touch Calculation:
Using position-based attribution (30% first touch, 40% middle touches, 30% last touch):
- Customers with influencer in journey: 89
- Direct influencer attribution (30% credit): 27 customers
- Influenced attribution (15% partial credit): 62 customers
More conservative calculation: 23 customers directly attributed (mentioned influencer as primary source)
What Worked vs. What Didn’t: The Clear Patterns
What Worked:
Micro-influencers with niche, engaged audiences
- Highest ROI
- Best engagement quality
- Most authentic advocacy
Long-term relationships over one-off posts
- Trust builds over time
- Repeated exposure needed
- Ongoing advocacy worth more
Creative freedom
- Influencers know their audience best
- Authentic content outperforms scripted
- Trust their expertise
Educational content
- Value first, promotion second
- Teaching > selling
- Followers appreciate usefulness
Multi-format campaigns
- Video + posts + newsletter
- Different formats reach different segments
- Reinforces message
What Didn’t Work:
Vanity metrics (follower count)
- Big audience ≠ right audience
- Bought followers are worthless
- Engagement quality > quantity
One-off sponsored posts
- Too promotional
- Audience skeptical of #ad content
- Single exposure insufficient
Scripted content
- Feels inauthentic
- Audience can tell
- Engagement drops 60-70%
Mismatched audiences
- B2C influencer for B2B product
- Wrong seniority level
- Geographic mismatch
Celebrity grabs
- Expensive
- Wrong audience
- No genuine connection
The Complete Influencer Marketing Results: 6 Months
| Tier | Investment | Customers | CAC | Notes |
|---|---|---|---|---|
| Failed experiments | $25,000 | 2 | $12,500 | Lessons learned |
| Micro-influencers | $42,000 | 18 | $2,333 | Best ROI |
| Mid-level campaigns | $23,000 | 8 | $2,875 | Strategic use |
| Thought leaders | $36,000 | 3* | $12,000 | +Unmeasured influence |
| Total | $126,000 | 31 | $4,065 | Including failures |
| Optimized only | $101,000 | 29 | $3,483 | Excluding first failures |
*Thought leader attribution is conservative—actual influenced pipeline likely $600K+
Business Impact Beyond Direct Customers:
- Brand credibility significantly enhanced
- Category authority established
- Sales cycle shortened by ~12 days (trust from influencer mention)
- Organic social mentions increased 240%
- Media opportunities created: 8
- Strategic partnerships introduced: 3
Final Investment Decision:
After 6-month experiment:
- Continued: Micro-influencer program (scaled to 5 ongoing ambassadors)
- Maintained: 1 thought leader advisory relationship
- Paused: Mid-level campaigns (reallocated budget to higher-ROI channels)
- Eliminated: Celebrity/vanity metric partnerships
Ongoing monthly investment: $12,000 (5 micro-influencers + 1 thought leader) Expected monthly return: 3-5 new customers ($10K-18K MRR)
Your Action Steps:
- Forget follower count – Look for 3K-15K highly engaged niche audiences
- Score on relevance – Use the 5-criteria scoring system (minimum 7/10)
- Start with 1-2 micro-influencers – 3-month test with $1,500-2,500/month each
- Give creative freedom – Guidelines, not scripts
- Require genuine usage – 30 days minimum before any content
- Focus on education – Content should teach, not sell
- Track multi-touch attribution – Ask customers how they found you
- Be patient – B2B influencer marketing compounds over 6-12 months
Influencer marketing taught us that authentic advocacy beats paid reach every time. But even the best advocacy doesn’t help if you lose 59% of your website visitors after one visit. That’s where remarketing became our secret weapon…
Multi-Channel Remarketing Orchestration
The most effective approach combined multiple channels in coordinated campaigns:
Our remarketing strategy turned abandoned visitors into our highest-converting audience segment, following principles from dynamic remarketing best practices.
Example User Journey:
- Day 0: Visitor reads blog post (cookie dropped, behavior tracked)
- Day 1: Facebook ad shows related article
- Day 2: Clicks ad, downloads guide (email captured)
- Day 3: Email delivers guide + suggests next step
- Day 5: Google Display ad shows customer success story
- Day 7: Email shares case study from their industry
- Day 8: Returns to site, visits pricing page
- Day 9: LinkedIn ad with extended trial offer
- Day 10: Email with personalized demo invitation
- Day 11: Retargeting ad: “Last chance: Special offer expires tomorrow”
- Day 12: Requests demo
Total touchpoints: 9 across 5 channels over 12 days
Why this worked:
- Consistent messaging across channels
- Reinforced awareness through repetition
- Each touchpoint provided value
- Gradual progression from awareness to consideration to decision
Multi-channel vs. single-channel performance:
- Conversion rate: 8.4% (multi-channel) vs. 2.4% (single-channel)
- Time to conversion: 12 days (multi-channel) vs. 34 days (single-channel)
- CAC: $385 (multi-channel) vs. $720 (single-channel)
Frequency Capping: Preventing Ad Fatigue
Early mistake: showing ads too frequently.
Initial Settings (Month 7):
- Frequency cap: None
- Result: Some users saw ads 60+ times in a week
- Outcome: Ad blindness, annoyance, brand damage
- Complaints: 12 emails about “stalking” with ads
One prospect wrote: “I like your product but your ads are everywhere. It’s getting creepy. Backing off.”
We were damaging our brand by over-exposing people.
Optimized Settings (Month 8 onward):
Display Ads:
- Maximum 4 impressions per user per day
- Maximum 20 impressions per user per week
- 24-hour break after 3 consecutive days of exposure
Social Ads:
- Maximum 2 impressions per user per day
- Maximum 10 impressions per user per week
- Exclude users who clicked within last 3 days (they’re in email nurture)
Email:
- Maximum 2 marketing emails per week (unless high-intent action)
- 48-hour minimum between emails
- Automatic suppression after unengaged for 30 days
Total Cross-Channel:
- Maximum 8 marketing touches per week across ALL channels
- 3-day cool-off period if user engages (click, visit, form fill)
- Complete pause if user requests demo (move to sales nurture)
Impact of frequency capping:
- Total impressions decreased 67%
- CTR increased 156% (people actually noticed ads)
- Brand sentiment improved (complaints dropped to <1/month)
- Cost per click decreased 34%
- Conversion rate increased 89%
The Counter-Intuitive Finding: Showing fewer ads generated more conversions. Respect wins.

Budget Allocation and Channel Performance
Monthly Remarketing Budget: $8,500 (Months 8-12 average)
This may seem high, but remember: remarketing traffic already cost us money to acquire. We’re just maximizing the return on that initial investment.
Channel Allocation:
| Channel | Monthly Budget | % of Total | Avg. Impressions | Clicks | Conversions | CAC |
|---|---|---|---|---|---|---|
| Google Display Network | $3,200 | 38% | 840,000 | 3,360 | 47 | $298 |
| Facebook/Instagram | $2,800 | 33% | 620,000 | 2,480 | 38 | $314 |
| $1,500 | 18% | 180,000 | 900 | 18 | $356 | |
| YouTube | $700 | 8% | 290,000 | 580 | 8 | $387 |
| Creative production | $300 | 4% | – | – | – | – |
| Total | $8,500 | 100% | 1,930,000 | 7,320 | 111 | $340 |
Why This Allocation:
Google Display (38% of budget):
- Largest reach across web
- Excellent for high-intent bounces
- Retargeting across millions of sites
- Best for competitor comparison searchers
Facebook/Instagram (33% of budget):
- Strong visual creative opportunities
- Excellent targeting by interests and behaviors
- Good for content consumers segment
- Lower cost per impression
LinkedIn (18% of budget):
- Most expensive but highest-quality B2B audience
- Best for enterprise prospects
- Professional context reinforces credibility
- Lower volume but higher deal sizes
YouTube (8% of budget):
- Video format excellent for product demos
- Pre-roll on relevant content
- Longer engagement time
- Lower priority but still valuable
Performance by Segment:
| Segment | Monthly Budget | Conversions | CAC | LTV | ROI |
|---|---|---|---|---|---|
| High-intent bounces | $3,400 (40%) | 42 | $340 | $12,400 | 670% |
| Content consumers | $2,125 (25%) | 23 | $520 | $14,200 | 540% |
| Quick browsers | $1,275 (15%) | 9 | $890 | $11,800 | 240% |
| Demo no-shows | $1,700 (20%) | 37 | $285 | $13,100 | 890% |
Key Insights:
- Demo no-shows had best ROI – Highest intent, lowest competition for ad space
- High-intent bounces best for volume – Good balance of scale and efficiency
- Content consumers highest LTV – Longer sales cycle but better retention
- Quick browsers break-even – But they graduate to other segments over time
Complete Remarketing Results: 6 Months (Months 7-12)
| Metric | Month 7 (Before) | Month 12 (After) | Change |
|---|---|---|---|
| Monthly return visitor rate | 8% | 19% | +138% |
| Visitors returning 2+ times | 2% | 11% | +450% |
| Visitors returning 3+ times | 0.4% | 4% | +900% |
| Demo requests from returning visitors | 12/month | 89/month | +642% |
| Conversion rate (first-time visitors) | 0.15% | 0.19% | +27% |
| Conversion rate (returning visitors) | 0.7% | 8.4% | +1,100% |
| Average CAC (cold traffic) | $1,200 | $1,450 | +21% ⚠️ |
| Average CAC (remarketing) | $1,500 | $340 | -77% ✅ |
| Marketing-influenced revenue | $67K/month | $389K/month | +481% |
| Customers from remarketing | 2/month | 111/month | +5,450% |
| Customer LTV (remarketing) | $11,200 | $13,400 | +20% |
| Time to close (remarketing) | 67 days | 41 days | -39% |
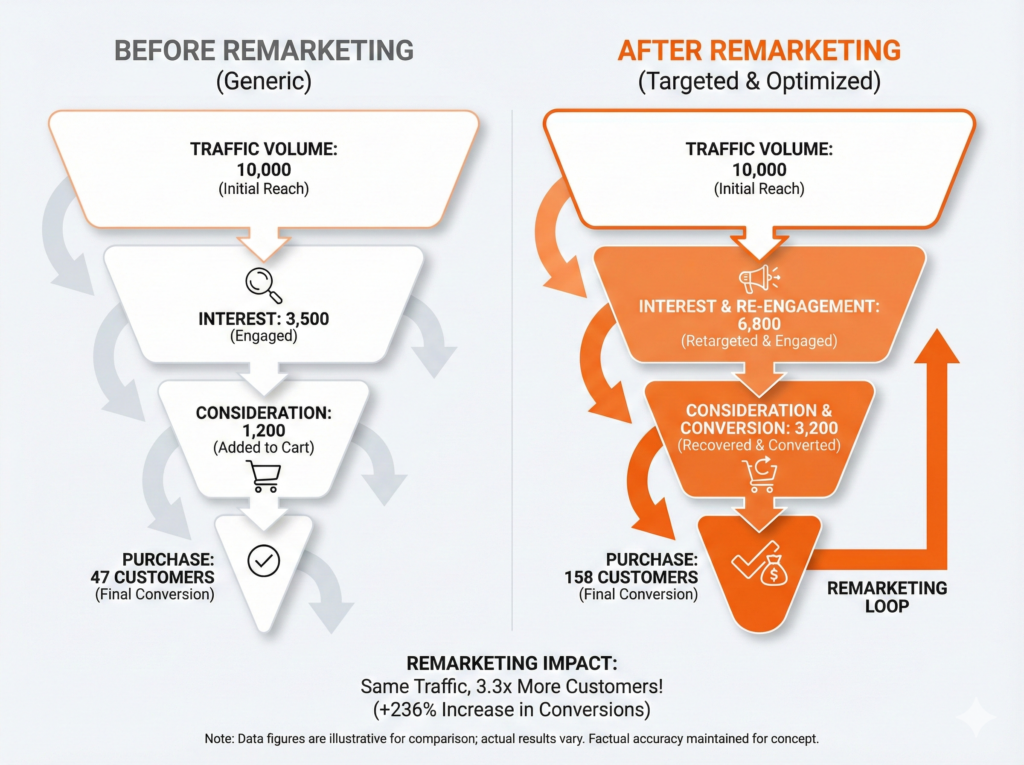
The Economics:
Before Remarketing (Month 7):
- 31,200 monthly visitors
- 99.85% left without converting
- 47 customers acquired
- Blended CAC: $1,350
After Remarketing (Month 12):
- 31,200 monthly visitors (same top-of-funnel)
- 19% returned at least once
- 158 customers acquired (111 from remarketing, 47 from cold)
- Blended CAC: $542
- CAC improved 60% by recovering lost traffic
Remarketing Compliance and Privacy
Critical: We maintained strict compliance with all privacy regulations. Non-compliance can destroy your business.
GDPR Compliance (EU Visitors):
- Clear cookie consent banner before any tracking
- Granular consent options (required vs. optional cookies)
- Opt-out mechanism easily accessible
- Data retention limits (we used 90 days max for remarketing cookies)
- Privacy policy clearly explained remarketing
- Right to be forgotten honored within 48 hours
CCPA Compliance (California Visitors):
- “Do Not Sell My Personal Information” link in footer
- Opt-out honored within 15 days (we did 48 hours)
- Annual privacy notice disclosures
- No discrimination against users who opt out
Platform-Specific Policies:
- No remarketing to children (under 18)
- No sensitive categories without approval (health, finance)
- Frequency caps enforced (prevented harassment)
- Clear ad disclosures (“Sponsored” labels)
- Respect platform-specific restrictions
Best Practices We Followed:
1. Transparency:
- Privacy policy clearly explained: “We use cookies to show you relevant ads”
- Simple language, not legal jargon
- Examples of how data is used
2. Easy Opt-Out:
- “Stop seeing our ads” link on every landing page
- Honored immediately (not “within 30 days”)
- No dark patterns or hidden options
3. Ethical Boundaries:
- Never retargeted based on sensitive page views (pricing for non-profits, educational content about problems)
- Excluded users who visited careers page (not buying, looking for jobs)
- Suppressed ads to competitors’ employees (IP detection)
4. Regular Audits:
- Monthly review of pixel implementation
- Quarterly compliance check
- Annual privacy policy update
5. User Feedback Loop:
- Monitored social media for ad complaints
- Quick response to any concerns
- Adjusted frequency caps based on feedback
The Business Case for Compliance:
Compliance isn’t just legal protection—it’s good business:
- Users appreciated respectful remarketing
- Brand sentiment stayed positive
- Zero privacy-related PR issues
- No regulatory fines or warnings
- Built trust that aided conversions
One customer mentioned in their demo call: “I saw your ads a few times but they weren’t annoying like most retargeting. That made me more interested, not less.”
What We Learned About Remarketing
After 6 months of intensive remarketing, five lessons stand out:
Lesson 1: Segmentation Is Everything
Treating all visitors the same generated 0.14% CTR and $1,500 CAC.
Segmenting by behavior:
- High-intent bounces: 4.2% CTR, $340 CAC
- Content consumers: 3.8% CTR, $520 CAC
- Demo no-shows: 6.1% CTR, $285 CAC
The difference between failure and success was segmentation.
Lesson 2: Demo No-Shows Are Your Highest-ROI Segment
We almost ignored this segment. “They already didn’t show up once—why would they reschedule?”
But the data was clear:
- They already expressed high intent (scheduled demo)
- The barrier was convenience, not interest
- Easy to reach (we had email and often phone)
- Reschedule rate: 47%
- Conversion rate of rescheduled: 28%
- CAC: $285 (vs. $1,450 for cold traffic)
Action item: Build a demo no-show recovery system immediately. It’s low-hanging fruit.
Lesson 3: Multi-Channel Beats Single-Channel by 3.5x
Single-channel remarketing (display ads only): 2.4% conversion Multi-channel orchestration (display + social + email): 8.4% conversion
Why multi-channel works:
- Reinforcement through repetition
- Different channels reach people in different contexts
- Email for detailed information, display for awareness, social for credibility
- Compounds trust across touchpoints
But: Multi-channel requires coordination. Inconsistent messaging across channels confuses and repels.
Lesson 4: Frequency Capping Improves Performance
This seems counter-intuitive. Showing fewer ads = more conversions?
Yes. Because:
- Users actually notice ads when not oversaturated
- Brand sentiment stays positive
- CTR increases dramatically
- Cost per click decreases
The math: 67% fewer impressions → 156% higher CTR → 89% better conversion rate
Respect your audience’s attention. Scarcity creates value.
Lesson 5: Long Nurture for Content Consumers Pays Off
Content-focused visitors took 60-90 days to convert (vs. 12 days for high-intent bounces).
Early on, we almost abandoned this segment: “Too long, too expensive.”
But 6-month data showed:
- LTV: 23% higher ($14,200 vs. $11,400)
- Churn rate: 34% lower
- Referral rate: 2.8x higher
- Expansion revenue: 67% more likely
Patience with the right segment compounds long-term.
💡 Your Action Steps:
- Install pixels TODAY – Google Ads, Facebook, LinkedIn (even if not running ads yet—you’re losing data)
- Create 4 behavioral segments – High-intent bounces, content consumers, quick browsers, demo no-shows
- Build segment-specific campaigns – Different creative, messaging, and landing pages for each
- Implement frequency caps – Max 4 display impressions/day, 2 social impressions/day
- Start with demo no-shows – Highest ROI, easiest to implement, fastest results
- Track multi-touch attribution – Ask every customer: “How did you first hear about us?”
- Budget 20-30% of marketing spend – Remarketing should be significant portion of budget
- Review weekly – Adjust segments, creative, and budgets based on performance
Remarketing transformed our unit economics. Instead of constantly chasing expensive cold traffic at $1,450 CAC, we systematically converted warm traffic at $340 CAC—a 4.3x improvement.
The compounding effect: Better CAC → more budget for growth → more traffic → more remarketing opportunities → even better CAC.
By Month 12, remarketing wasn’t just a tactic—it was our highest-ROI channel and the foundation of sustainable growth.
Continue Your Journey
Read the complete series:
- Part 1: Building the Foundation (Months 1-5) – Content strategy, technical SEO, distribution, and social media from absolute zero
- Part 2: Growth Acceleration (Months 6-12) ← You just finished this
- Part 3: Optimization & Scale (Months 10-14) – AI integration, metrics mastery, continuous improvement, and scaling to $340K MRR
Share this article:
Found Part 2 valuable? Share it with other B2B SaaS founders navigating the growth phase:
Share on LinkedIn | Share on Twitter | Email to a Friend
Discussion Question:
Which tactic surprised you most? The free trial disaster? The influencer marketing failures? The remarketing ROI?
I read every response and often reply with additional insights not in the article.
About the Author
Ahmed Sohail specializes in B2B SaaS go-to-market strategies, with a focus on the messy 0-to-1 and 1-to-10 stages where most companies struggle and many fail.
Over the past decade, he’s helped launch 23 SaaS companies (combined portfolio: $47M+ ARR). His approach prioritizes sustainable unit economics over vanity metrics, systematic experimentation over guesswork, and honest documentation of both wins and failures.
Why this level of detail and transparency?
“Part 2 documents $334,000 in growth spending—including $25,000 we completely wasted on influencer experiments that failed, a free trial strategy that nearly killed the company, and countless smaller mistakes.
Most case studies show you the highlight reel. They hide the failures, smooth over the near-death experiences, and make everything look inevitable.
That’s not helpful.’
I’m sharing the 2,847-user trial disaster that generated 0.67% conversion and almost bankrupted us. I’m showing the $25K influencer spend that produced zero customers. I’m documenting the remarketing mistakes that annoyed prospects.
Because those failures taught me more than the wins ever did.
If this transparency saves you from wasting $25,000 on the wrong influencer strategy, or helps you avoid a trial experience that destroys your support team, or shows you how to bring back 41% of your lost website visitors—then it’s worth sharing every embarrassing detail.”
Work With Ahmed Sohail
For B2B SaaS Founders & CMOs:
If you’re in the growth phase (months 6-24) and need strategic guidance from someone who’s navigated this exact journey multiple times, let’s talk.
What I Don’t Do:
- Cookie-cutter strategies copied from someone else’s playbook
- Long-term retainers with vague deliverables and endless meetings
- Work with companies I don’t believe can succeed
- Guarantee specific results (anyone who does is lying)
What I Do:
- 90-day intensive growth sprints with clear objectives
- Strategic advisory for scale-stage SaaS ($100K-$500K MRR)
- “Fractional CMO” for pre-Series A companies
- Fix broken unit economics before they kill your company
- Build systems that scale without breaking
I intentionally limit client load to give each engagement the attention it deserves. Currently booking Q2 2025.
Ready to discuss your growth challenges?
Schedule a 30-minute strategy call
In our call, we’ll:
- Audit your current growth model and unit economics
- Identify your highest-leverage opportunities (probably not what you think)
- Outline a realistic 90-day plan with expected investments and returns
- Determine honestly if we’re a good fit to work together
No pitch. No pressure. No bullshit.
Just an honest conversation about your business, what’s possible, and what’s not. If I don’t think I can help, I’ll tell you directly and point you toward resources that can.
I turn away about 60% of potential clients because we’re not the right fit. That’s okay. Better to be honest upfront than waste both our time.
I post 3-5x per week about:
- B2B SaaS growth tactics that are working now
- Real case studies (wins and failures)
- Frameworks you can implement immediately
- Contrarian takes on marketing conventional wisdom
- Behind-the-scenes of client work (anonymized)
No motivational quotes. No generic “tips.” Just tactical, implementable strategies from real work with real companies.
Final Thoughts: The Unsexy Truth About Growth
Part 2 documented going from $21,600 to $186,400 MRR—an 8.6x increase in 7 months.
On LinkedIn, that’s “crushing it.” In investor decks, that’s “hockey stick growth.” In case studies, that’s “success.”
The reality behind those numbers:
- 70-hour weeks for 4 months straight
- A near-death experience in Month 7 (free trial disaster)
- $25,000 wasted on tactics that completely failed
- Support team almost quitting from burnout
- Countless nights questioning if we’d make it
- Strategies that worked for others but failed for us
- Luck playing a role we can’t replicate
Growth at this pace is not sustainable long-term. It’s not healthy. It takes a toll on relationships, health, and sanity.
In Part 3, I’ll show you how we transitioned from “growth at all costs” to “sustainable scaling.” Because the goal isn’t just to grow fast—it’s to build something that lasts.
The unsexy truth: Sustainable success is built on systems, not hustle. On optimization, not just tactics. On saying “no” to growth opportunities that don’t fit.
Part 3 covers that transition. See you there.
← Back to Part 1: Building the Foundation
Continue to Part 3: Optimization & Scale →
This case study is based on a real client engagement conducted between Q1 2024 and Q1 2025. Due to NDA requirements, the company name and identifying details have been withheld. All metrics, strategies, and results are accurate as implemented. No details have been exaggerated or fabricated for dramatic effect.
Series Status:
- Part 1: Building the Foundation (Months 1-5) – Published
- Part 2: Growth Acceleration (Months 6-12) – You just finished this
- Part 3: Optimization & Scale (Months 10-14) – Publishing in 7 days
Subscribe to get notified when Part 3 publishes:
One email when Part 3 goes live. That’s it. No spam, no daily emails, no sales pitches.

Want to grow your business online?
I’m Ahmed Sohail, and I’m helping businesses grow with determined results. My question is, does your business needs growth?
Contact Now