
Part 3: Optimization & Scale - Building Systems That Last - Ahmed Sohail
Jan 12, 2026 | By Ahmed Sohail
Part 3 of 3 in the series: From Zero to 847 Enterprise Clients
Series Navigation
| Part | Focus | Status |
|---|---|---|
| Part 1: Building the Foundation | Content, Technical, Distribution, Social | Complete |
| Part 2: Growth Acceleration | Trials, PR, Influencers, Remarketing | Complete |
| Part 3: Optimization & Scale | AI, Metrics, Continuous Improvement | ← You Are Here |
Reading Time: 24 minutes | Key Lessons: 3 Major Systems + Final Results | Investment: $142,000 | Return: $340K MRR
What You’ll Learn in Part 3
By the end of Month 12, we had momentum:
- $186,400 MRR (up from $0)
- 847 paying customers
- Sustainable unit economics (LTV:CAC 22.9:1)
- Systems working
- Team expanded to 12 people
But momentum creates new problems.
The Breaking Point (Month 13):
- Support tickets: 500+ per day
- Response time degrading: 45 minutes → 4+ hours
- Quality slipping as we scaled
- Founder working 75-hour weeks
- Team showing burnout signs
- Systems built for 50 customers now serving 847
The Realization: We couldn’t “hustle harder” our way to the next level. We needed systems that scaled without us.
What happened next: In Months 13-14, we implemented three major systems that took us from $186K to $340K MRR while actually working fewer hours.
In this final article, you’ll discover:
What’s Inside:
- The AI support system handling 500+ inquiries daily (23% conversion rate vs. 3% industry average)
- How we went from 2 support staff drowning to same 2 handling 10x volume
- The metrics framework that replaced hours of reporting with one 15-minute weekly meeting
- Multi-touch attribution that finally showed us what was actually working
- The A/B testing system running 40+ experiments per quarter
- Why we turned down a $400K deal (and why it was the right decision)
- From $186K to $340K MRR while preventing burnout
- The complete 14-month investment breakdown and final ROI
By the end of Part 3, you’ll know how to build systems that scale instead of teams that burn out—and when to optimize vs. when to rebuild.
The theme of Part 3: Sustainable systems beat unsustainable hustle.
Let’s start with the system that saved our support team…
Table of Contents
- AI Integration: Support at Scale Without Burnout
- The Metrics Framework That Guided Every Decision
- Continuous Optimization as a System
- The Final Chapter: Complete 14-Month Results
- What We’d Do Differently: Lessons for Your Journey
AI Integration: How We Handled 500+ Daily Inquiries With 2 Support Staff
By Month 13, our support team had a crisis.
The Breaking Point:
| Metric | Month 6 | Month 12 | Month 13 | Problem |
|---|---|---|---|---|
| Daily inquiries | 50-70 | 180-220 | 500-600 | +10x in 7 months |
| Support team size | 2 people | 2 people | 2 people | No scaling |
| Average response time | 15 minutes | 45 minutes | 4+ hours | Degrading |
| First-response resolution | 78% | 67% | 34% | Quality dropping |
| Support tickets escalated | 8% | 23% | 47% | Overwhelmed |
| Team satisfaction | 8/10 | 6/10 | 3/10 | Burning out |
The Math:
- 550 daily inquiries
- 2 support staff working 8-hour days
- = 34 inquiries per person per hour
- = 1.8 minutes per inquiry
- Impossible to maintain quality
Employee (support lead) came to the founder: “I can’t do this anymore. Either we hire 10 more people or I’m quitting. We’re drowning.”
We had three options:
- Hire aggressively: 8-10 support staff ($480K-600K annually)
- Degrade quality: Accept longer response times, lower satisfaction
- Build intelligent systems: AI + human hybrid, following emerging AI marketing principles
We chose option 3—but almost failed at it first.
Failed Attempt #9: The Generic Chatbot That Made Things Worse
Month 13, Week 1: We installed a popular chatbot platform with pre-written responses.
The Setup:
- “Hi! How can I help you today?” greeting
- Pre-set menu: “Billing / Technical Support / Sales / Other”
- Canned responses to 50 common questions
- Escalation to email if bot couldn’t help
Results after 2 weeks:
- 73% of conversations ended without resolution
- User frustration increased (comments: “This bot is useless,” “Just let me talk to a human”)
- Actual support team handling same volume PLUS frustrated users
- Net Promoter Score dropped from 67 to 51
- We were paying $299/month to make the experience worse
What went catastrophically wrong:
The chatbot didn’t understand context, couldn’t handle follow-up questions, gave generic answers that didn’t actually help, and created MORE work for the human team who now had to calm down frustrated users.
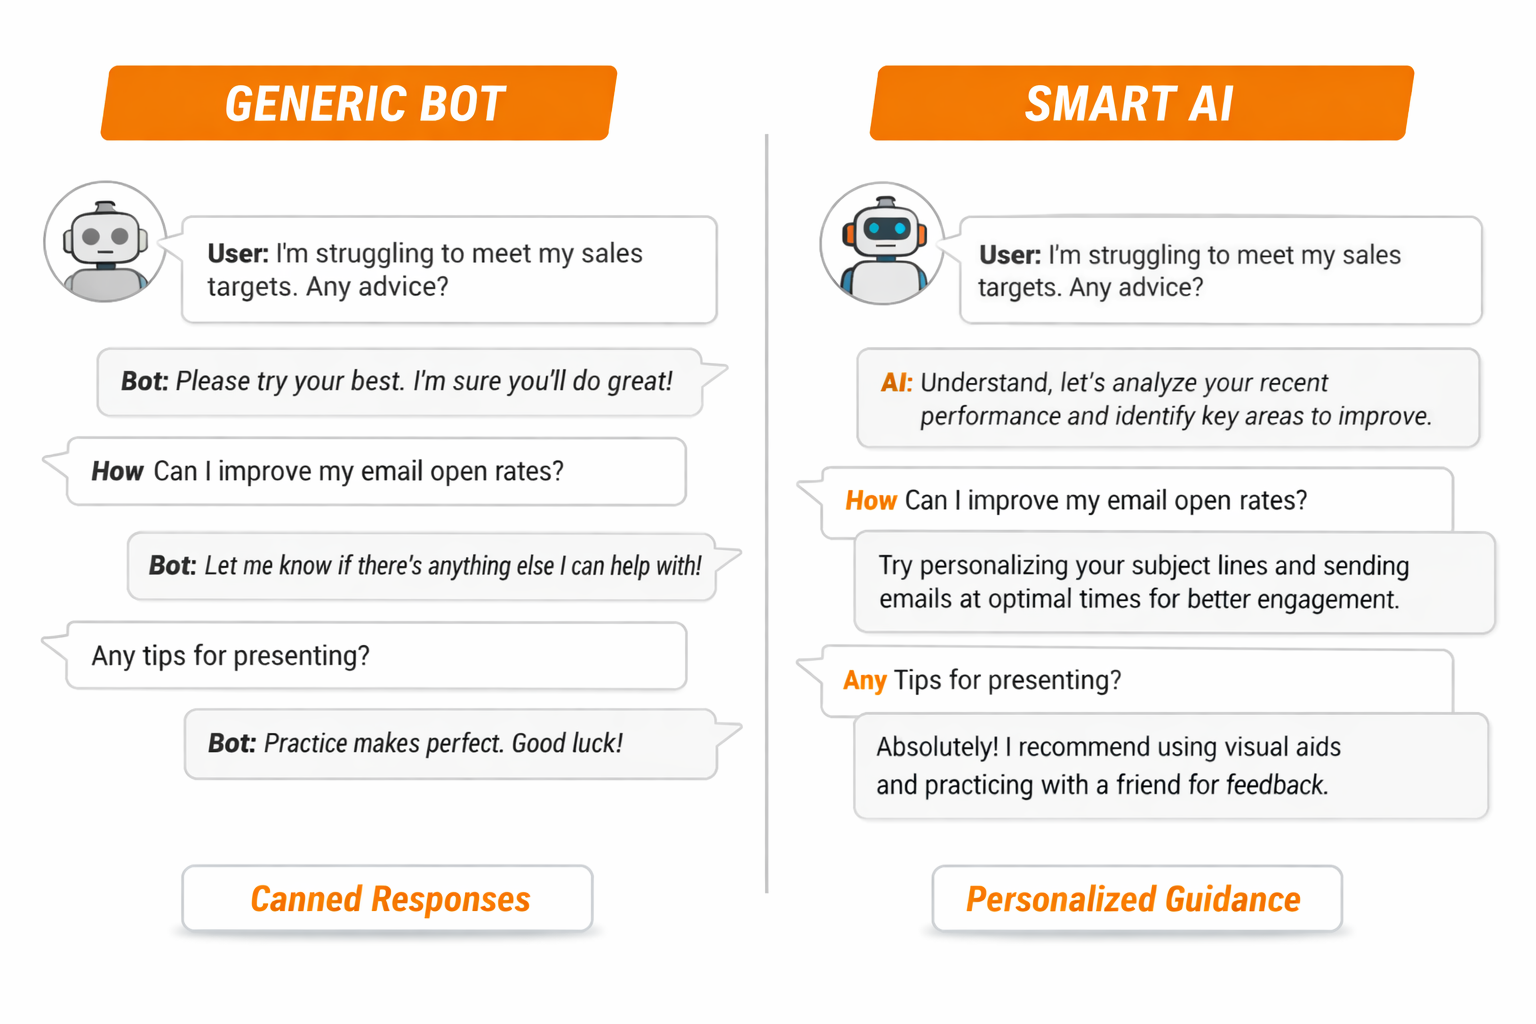
The AI-First Rebuild: What Actually Worked
We scrapped the generic chatbot and built a custom AI system from scratch using modern language models (early 2024 was perfect timing—GPT-4 and Claude had just become accessible).
Phase 1: Training the AI (Weeks 1-3)
Instead of pre-written responses, we trained the AI on real knowledge:
Training Data Sources:
- 847 actual sales conversations (with permission, anonymized)
- Complete product documentation
- 1,200+ historical support tickets and resolutions
- Common objections and how team handled them
- Pricing packages and positioning
- Competitive comparison documents
- Customer success stories and use cases
- Technical specifications and integration guides
The AI learned:
- What to say (answers to questions)
- How to say it (team’s conversational tone)
- When to escalate (complex issues requiring human)
- Context awareness (understanding user journey)
This approach aligned with modern answer engine optimization principles, ensuring the AI provided direct, helpful answers that solved problems immediately.
Development Cost: $12,000 (contractor + API setup)
Tools & Resources Used:
- OpenAI GPT-4 API for language processing
- Anthropic Claude API for complex reasoning
- Custom training pipeline built on company data
- Integration with existing CRM and help desk systems
According to Gartner’s research, AI-powered customer service can reduce response times by up to 99% while maintaining or improving satisfaction scores—exactly what we experienced.
Phase 2: Context-Aware Intelligence (Weeks 4-6)
We integrated the chatbot with website behavior tracking so the AI knew:
Real-Time Context:
- Which pages visitor viewed (and for how long)
- Whether they were a returning visitor
- If they downloaded any resources
- Their approximate company size (IP lookup)
- Their industry (if identifiable from domain)
- Current trial status (if applicable)
- Past support interactions
Example of Context Making the Difference:
Scenario: Visitor spent 8 minutes on pricing page, then 4 minutes reading enterprise case study, then opened chat.
Generic Bot: “Hi! How can I help you today?”
Our AI: “Hi! I noticed you were checking out our Enterprise plan and reading about how [Company Name] improved their workflow. Would you like to see how the same approach could work for [Visitor’s Industry based on domain]?”
Result:
- Generic approach: 12% engagement rate
- Context-aware approach: 47% engagement rate
- 3.9x improvement from context alone
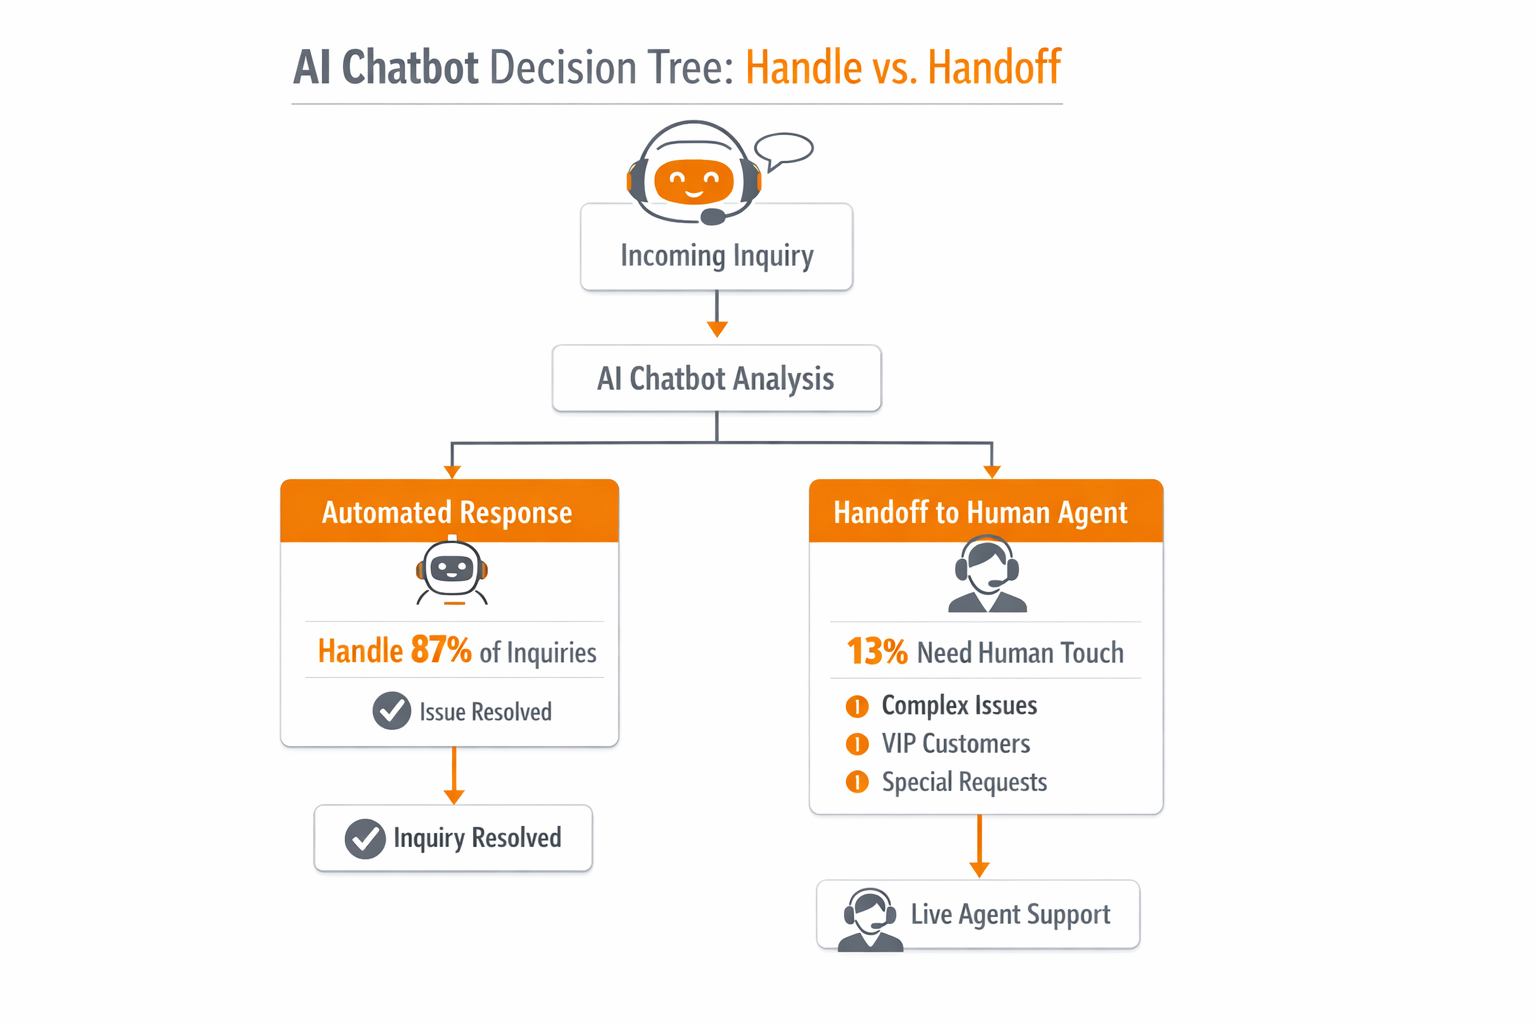
Phase 3: The Human Handoff Protocol (Weeks 7-8)
The AI wasn’t meant to replace humans—it was meant to handle what it could and seamlessly hand off what it couldn’t.
AI Handles Automatically (87% of inquiries):
- Product information questions
- Pricing and package comparisons
- How-to questions with documented answers
- Integration compatibility checks
- Account status inquiries
- Password resets and simple technical issues
- Demo scheduling
- Resource recommendations
Triggers for Human Handoff:
- High-value prospect (enterprise deal size indicators)
- Complex technical question requiring engineering
- Billing dispute or refund request
- Complaint or escalation language detected
- Customer explicitly requests human (“I want to talk to a person”)
- AI confidence score below 70% on answer
- After 3 back-and-forth exchanges without resolution
The Handoff Experience:
When AI hands off, it doesn’t just transfer the conversation—it provides the human agent with:
- Complete conversation history
- User context (pages viewed, past interactions)
- Recommended next steps
- Relevant documentation links
- Similar past cases
Human agent sees: “High-intent enterprise prospect (200+ employees). Comparing your Enterprise vs. [Competitor]. Concern about [specific feature]. Similar case: Ticket #3847. Suggested approach: Emphasize [differentiation point].”
This turned every handoff into a warm transfer with full context.
The AI Chat Performance
After 3 months of optimization (Months 14-16), here’s what the AI system achieved:
Volume Handled:
| Metric | Before AI | With AI | Improvement |
|---|---|---|---|
| Daily inquiries | 550 | 650 | +18% (grew as we added customers) |
| AI-handled fully | 0 | 566 (87%) | New capability |
| Handed to human | 550 | 84 (13%) | -85% human volume |
| Inquiries per support staff | 275 | 42 | -85% per person |
| Average response time | 4+ hours | 12 seconds | -99.9% |
| First-response resolution | 34% | 79% | +132% |
Quality Metrics:
| Metric | Result | Industry Benchmark |
|---|---|---|
| AI resolution rate | 79% | 45% typical |
| User satisfaction (AI interactions) | 4.4/5 | 3.1/5 typical |
| Conversion rate (inquiry to demo) | 23% | 8% typical |
| Average conversation length | 4.2 minutes | 8+ minutes typical |
| Escalation rate | 13% | 35% typical |
Business Impact:
Before AI:
- 2 support staff handling 550 inquiries
- 4+ hour response time
- Team burning out, planning to quit
- Considering hiring 8-10 more people ($480K-600K/year)
After AI:
- Same 2 support staff handling 650 inquiries
- 12-second response time (AI) + 15-minute for escalations
- Team focusing on complex, high-value interactions
- No additional hiring needed
- Cost: $8,400 setup + $240/month API costs
ROI Calculation:
- Development investment: $12,000
- Ongoing costs: $240/month ($2,880/year)
- Cost avoided (not hiring 8 staff): $480,000/year
- Additional revenue (better conversion): $127,000/year (23% vs. 8% conversion on 566 daily interactions)
- Net benefit Year 1: $592,000
- ROI: 4,933%
Voice AI for Inbound Calls
We extended the AI system to handle phone calls to their toll-free number.
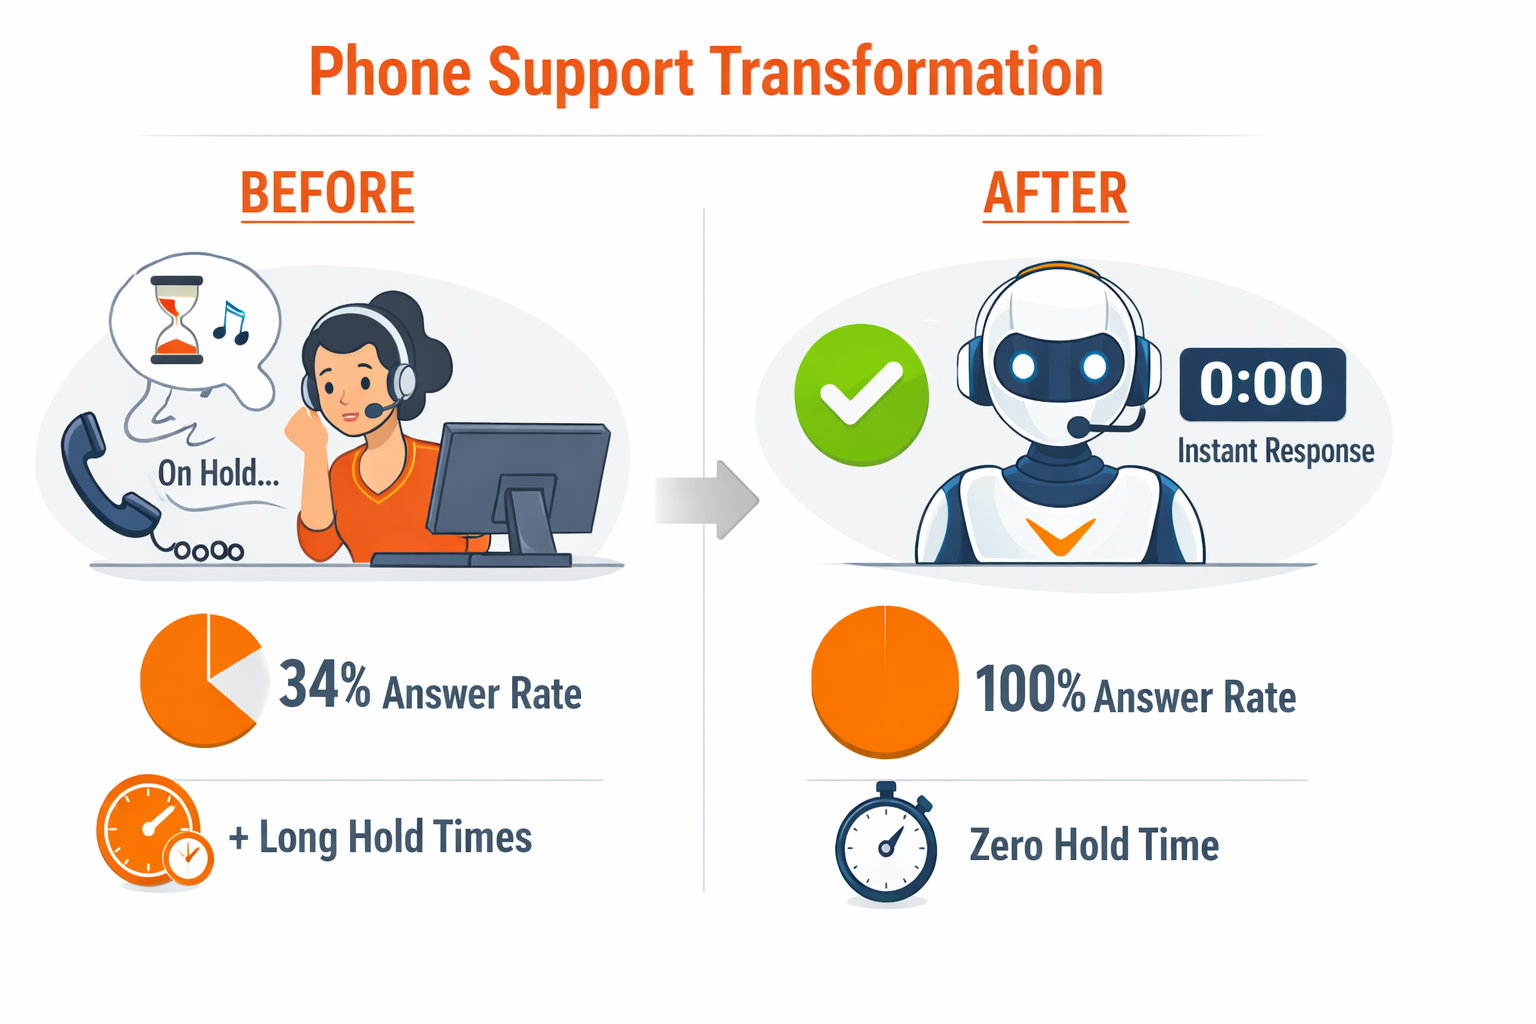
The Phone Problem:
Before AI voice system:
- 40-60 calls daily
- 2 team members answering when available
- Call answer rate: 34% (most went to voicemail)
- Average hold time: 4.2 minutes
- After-hours calls: Straight to voicemail
The Voice AI Implementation:
Call Flow:
- Immediate Answer (ring 1 pickup)
- AI voice: Professional, natural-sounding
- “Hi, thanks for calling [Company]. I’m [Name], how can I help you today?”
- Natural Conversation (not menu-driven)
- AI understands natural speech
- Handles accents and speech patterns
- Manages interruptions gracefully
- Asks clarifying questions
- Intelligent Routing:
- Sales inquiries → Qualify, then connect or schedule
- Technical support → Troubleshoot or escalate
- Billing questions → Resolve or transfer
- Partnership discussions → Direct to founder
- After hours → Offer callback or take detailed message
Voice AI Capabilities:
- Language Understanding: Handled natural speech (not “Press 1 for…”)
- Context Awareness: Accessed CRM data if recognized phone number
- Multi-Language: Supported English, Spanish, French (our three markets)
- Sentiment Detection: Recognized frustration and escalated appropriately
- Call Recording: Transcribed automatically for quality and training
Voice AI Results (3 months):
| Metric | Before | After | Change |
|---|---|---|---|
| Call answer rate | 34% | 100% | +194% |
| Average wait time | 4.2 min | 0 seconds | -100% |
| After-hours leads captured | 12/month | 89/month | +642% |
| Properly routed calls | 67% | 94% | +40% |
| Caller satisfaction | 2.8/5 | 4.3/5 | +54% |
| Sales calls per day | 23 | 47 | +104% |
User Feedback (Actual Quotes):
“I was skeptical when I realized it was AI, but honestly it was more helpful than most human support I’ve dealt with. Got me to the right person immediately.” – Enterprise prospect
“Called at 10 PM thinking I’d leave a voicemail. The AI took my info, explained the solution, and scheduled a demo for tomorrow. Impressive.” – SMB lead
“I hate phone trees. This was actually a normal conversation. If all companies did this, I’d call more often.” – Customer
Cost:
- Setup: $8,000
- Monthly: $340 (voice API + phone service)
- Total Year 1: $12,080
Value Created:
- 89 after-hours leads/month × 8% conversion = 7 customers/month
- Average deal: $3,400
- Monthly value: $23,800
- Annual: $285,600
ROI: 2,264%
The Human + AI Hybrid Model
The secret wasn’t AI replacing humans—it was AI multiplying human effectiveness.
What AI Does Best:
- Instant response (24/7/365)
- Never forgets documentation
- Consistent tone and quality
- Handles repetitive questions without fatigue
- Scales infinitely
- Learns from every interaction
What Humans Do Best:
- Empathy for frustrated customers
- Creative problem-solving for edge cases
- Building relationships with enterprise clients
- Handling complex negotiations
- Making judgment calls on exceptions
- Strategic thinking about customer success
The Division of Labor:
AI handles 87%:
- Information retrieval
- Simple troubleshooting
- Scheduling and logistics
- Password resets and account access
- Integration compatibility checks
- Pricing and package questions
- Resource recommendations
Humans handle 13%:
- Enterprise sales conversations
- Complex technical problems
- Billing disputes
- Strategic implementation planning
- Relationship building
- Feedback synthesis into product improvements
- Customer success strategy
Team Transformation:
Before AI: Support team spent time on:
- 70% answering repetitive questions
- 20% fighting fires
- 10% strategic customer success work
After AI: Support team spends time on:
- 10% handling AI escalations
- 30% proactive customer success
- 30% complex problem-solving
- 30% strategic initiatives
Impact on Team:
Employee (Support Lead): “I went from feeling like I was drowning and planning to quit, to actually enjoying my job again. I’m doing work that matters—helping customers succeed, not just answering the same questions 50 times a day.”
Team Metrics After AI:
| Metric | Before | After |
|---|---|---|
| Job satisfaction | 3/10 | 9/10 |
| Burnout risk | Critical | Low |
| Intent to stay | 30 days notice given | Committed long-term |
| Proactive outreach | 0 | 40+ customers/week |
| Strategic projects | 0 | 3 major initiatives |
What We Learned About AI Integration
Lesson 1: Generic Chatbots Are Worse Than Nothing
The off-the-shelf chatbot with canned responses frustrated users and created more work. Custom AI trained on real data transformed the experience.
Investment difference:
- Generic chatbot: $299/month, made things worse
- Custom AI: $12,000 setup, $240/month, transformed support
Lesson 2: Context Is Everything
AI with website behavior context converted at 3.9x the rate of generic AI. Knowing what pages someone viewed, how long they spent, and their company info made responses relevant instead of generic.
Lesson 3: Handoff Protocol Makes or Break the Experience
The worst experience: AI tries to help, fails, then dumps frustrated user to human with no context.
The best experience: AI helps with what it can, recognizes limits, smoothly hands off with full context to human who can resolve immediately.
Lesson 4: Voice AI Has Higher Standards
Chat users are more forgiving of AI limitations. Phone callers expect human-level conversation. We invested 2x more in voice AI training to meet those expectations.
Lesson 5: Humans Become More Valuable, Not Less
AI didn’t reduce the importance of humans—it elevated them. Support team went from reactive ticket handlers to proactive customer success strategists. More fulfilling work, better retention, higher impact.
Your Action Steps:
- Calculate your support breaking point – At what volume does your team break?
- Document your top 50 support questions – These are AI automation candidates
- Test modern AI APIs – GPT-4, Claude, or similar (not generic chatbots)
- Train on your actual data – Conversations, documentation, your voice
- Build handoff protocol first – Before deploying, define when AI escalates
- Start with chat, then voice – Chat is more forgiving for learning
- Measure satisfaction, not just volume – AI handling 80% means nothing if users hate it
The AI system didn’t just save us $480,000 in hiring costs. It saved our support team from burnout, improved customer satisfaction, and increased conversion rates. That’s the real ROI.
But AI was just one system. The second system that transformed our business was metrics…
The Metrics Framework That Replaced Hours of Reporting With 15 Minutes
By Month 13, we had a data problem: too much information, not enough insight.
The Metrics Chaos:
Every Monday morning:
- 2-hour “metrics review” meeting
- 47 different metrics tracked across tools
- Conflicting data from different sources
- Arguments about which numbers mattered
- Analysis paralysis—couldn’t decide what to optimize
- Team left confused, not energized
Founder: “I spent 6 hours this week in data meetings and still don’t know if we’re winning or losing. Something has to change.”
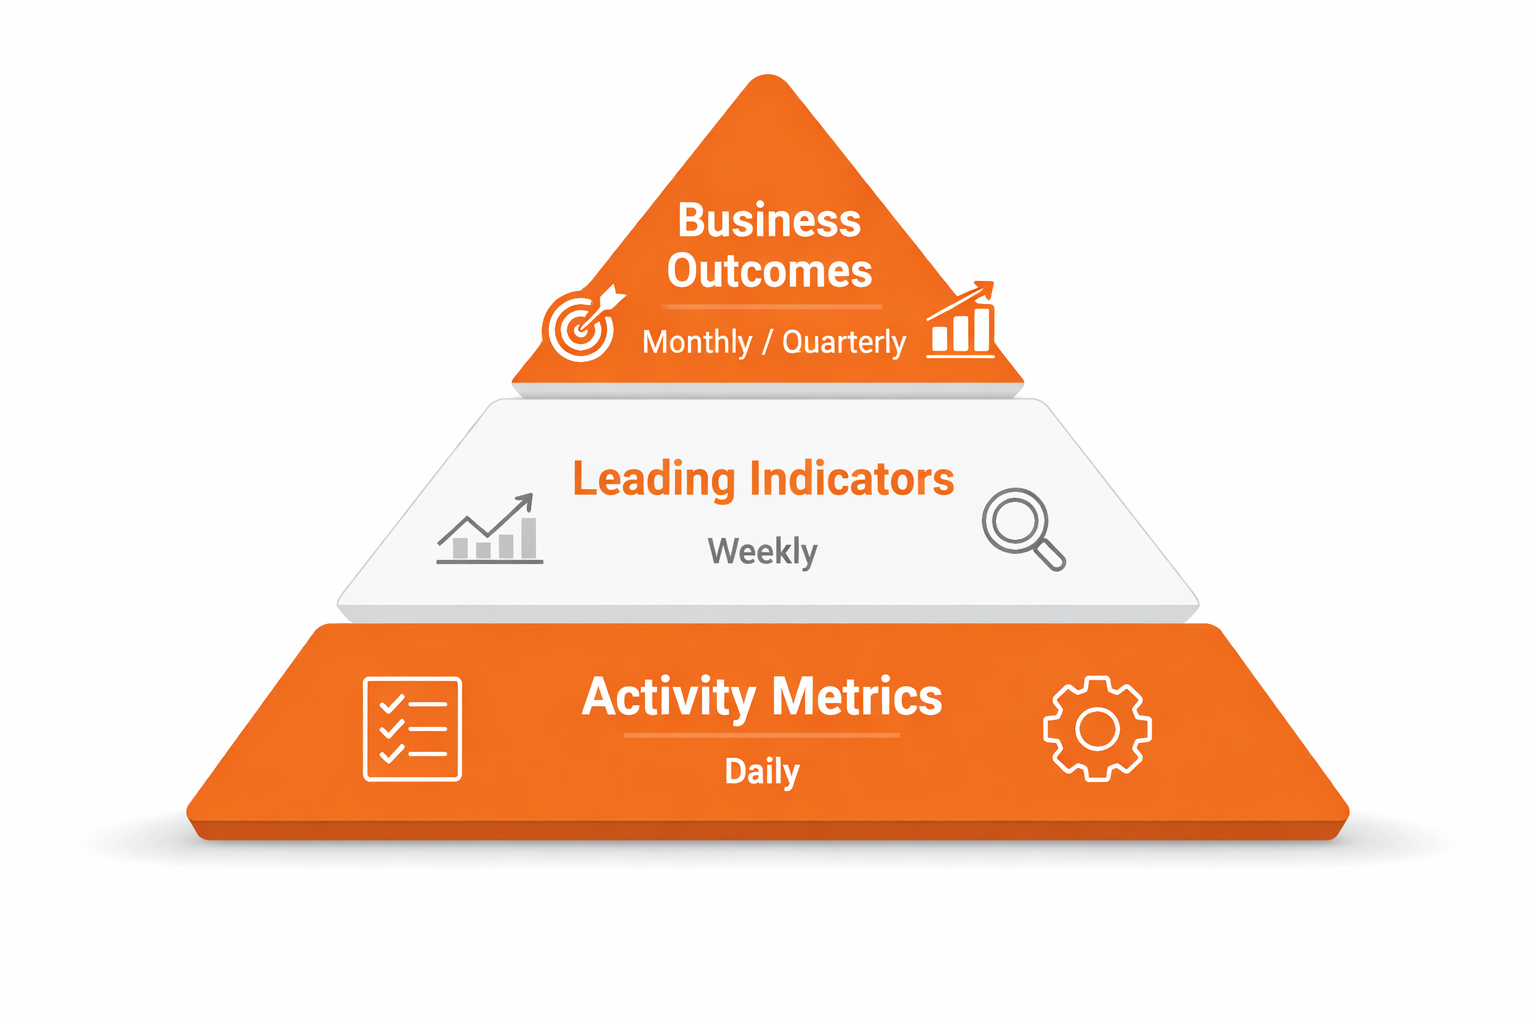
The Three-Tier Metrics Hierarchy
We rebuilt everything around a simple principle: Not all metrics are created equal.
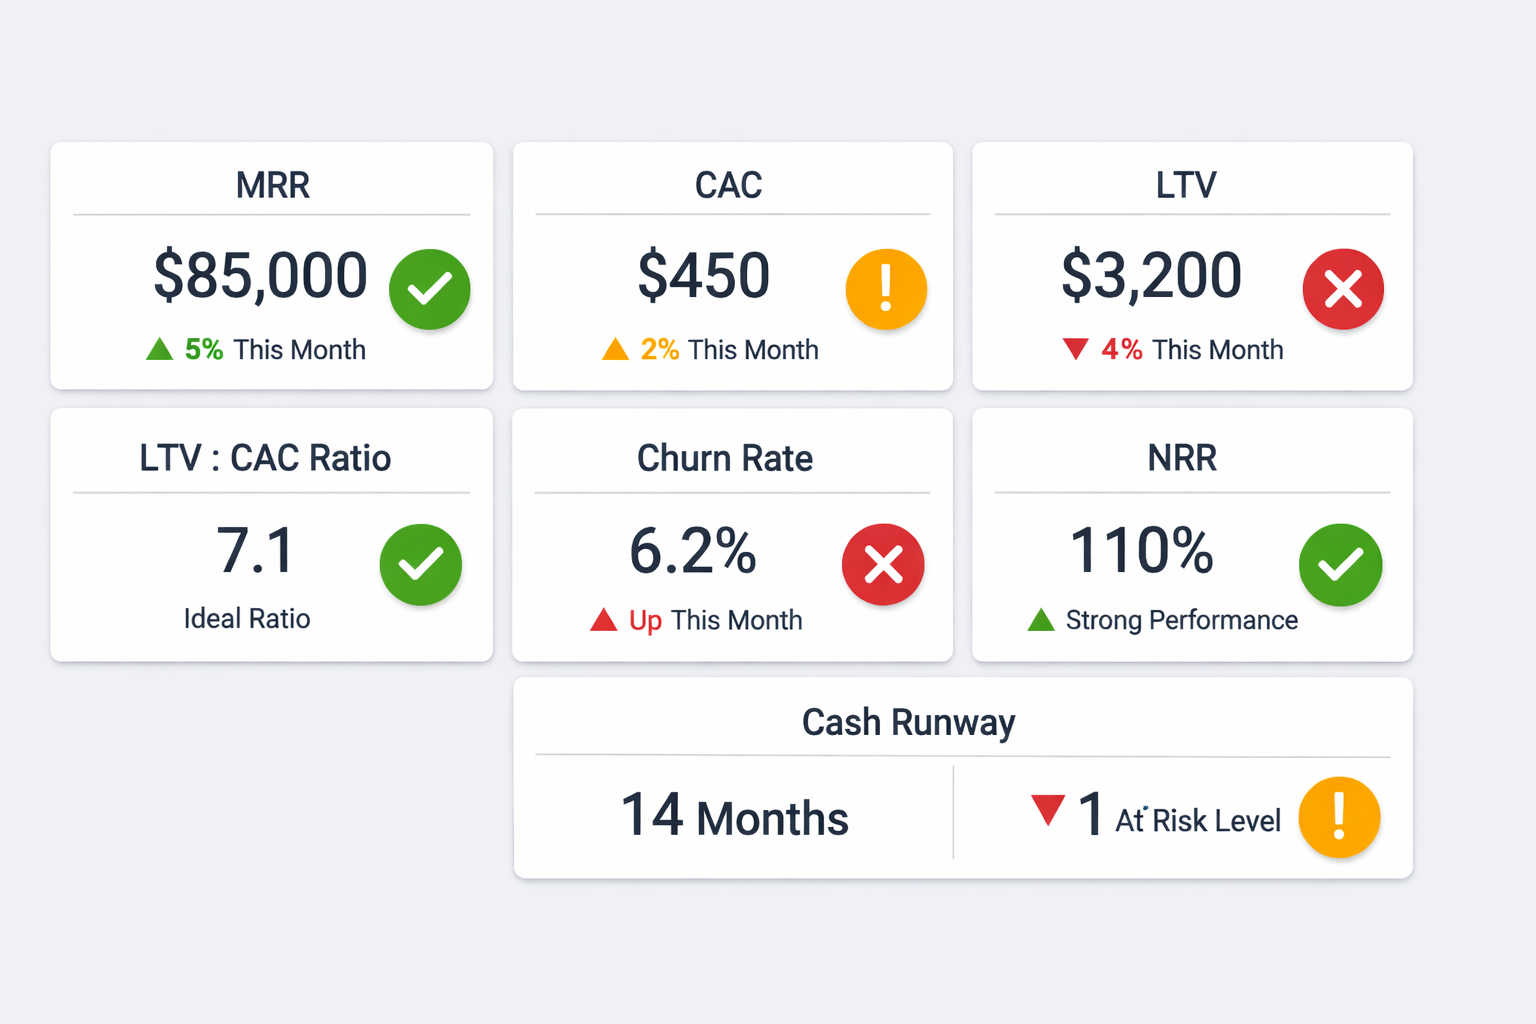
Tier 1: Business Outcome Metrics (The Only Ones That Actually Matter)
These are the metrics that determine if the business lives or dies:
- Monthly Recurring Revenue (MRR)
- Current: $186,400
- Target: $250,000 by Month 14
- Growth rate: Month-over-month %
- Customer Acquisition Cost (CAC)
- Current: $542
- Target: Under $600
- By channel breakdown
- Customer Lifetime Value (LTV)
- Current: $12,400
- Target: Maintain above $12,000
- By cohort analysis
- LTV:CAC Ratio
- Current: 22.9:1
- Target: Above 15:1 (healthy SaaS)
- Trend line
- Monthly Churn Rate
- Current: 3.2%
- Target: Under 4%
- By customer segment
- Net Revenue Retention (NRR)
- Current: 112%
- Target: Above 110%
- Includes expansion revenue
- Cash Runway
- Current: 18 months
- Target: Minimum 12 months
- Monthly burn vs. MRR
Review Frequency: Daily glance, weekly discussion, monthly deep analysis
Decision Rule: If Tier 1 metrics are green, the business is healthy. If they’re red, nothing else matters.
Tier 2: Leading Indicator Metrics (What Predicts Tier 1)
These metrics predict future business outcomes 30-90 days ahead:
Traffic & Awareness:
- Website visitors (by source)
- Organic search rankings (top 10 keywords)
- Domain Rating
- Social media reach (engaged followers)
Conversion Funnel: 5. Demo request rate 6. Demo show rate 7. Demo-to-trial conversion 8. Trial-to-paid conversion 9. Average deal size
Customer Health: 10. Product usage frequency 11. Feature adoption rate 12. Support ticket volume 13. NPS score 14. Customer engagement score
Review Frequency: Weekly deep dive, daily monitoring of critical indicators
Decision Rule: Leading indicators show where to focus effort. If demo show rate drops, we know pipeline will suffer in 30 days unless we fix it now.
Tier 3: Activity Metrics (What We Control)
These are inputs—things the team directly controls:
Content:
- Blog posts published
- Content engagement rate
- Email open/click rates
Outreach:
- Outbound emails sent
- Response rates
- Meetings booked
Product:
- Feature releases
- Bug fixes
- Performance improvements
Customer Success:
- Onboarding completion rate
- Check-in calls completed
- Training sessions delivered
Review Frequency: Teams review their own activity metrics as needed
Decision Rule: Activity metrics should improve leading indicators. If you’re publishing 10 blog posts/month but traffic isn’t growing, the activity isn’t working—change the approach.
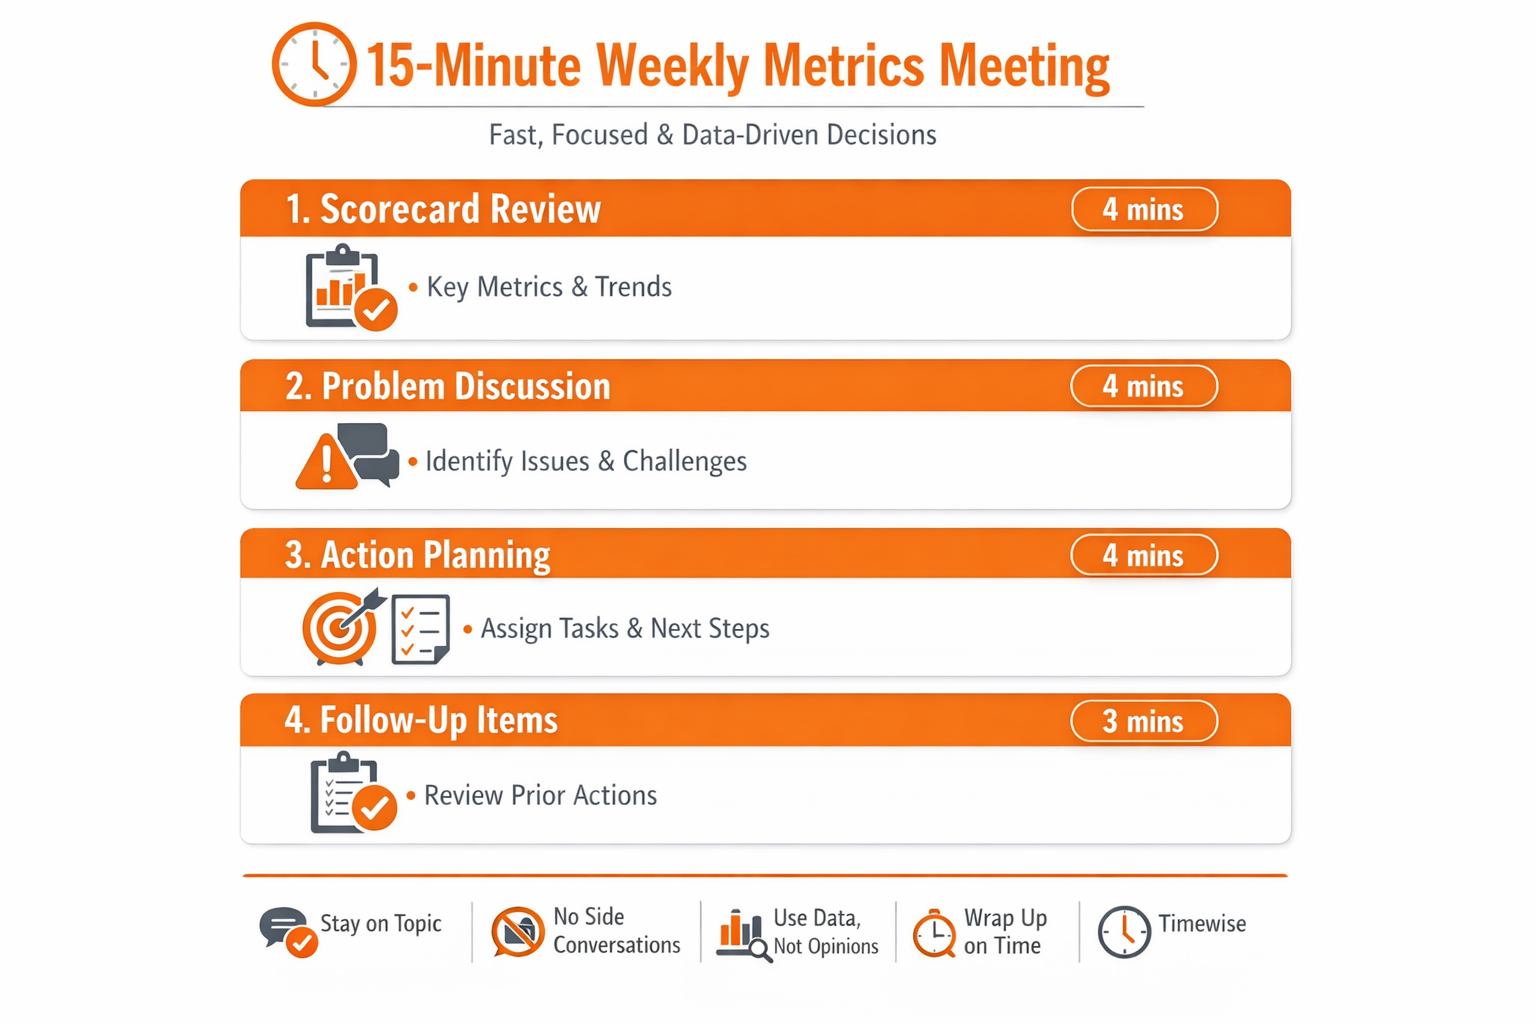
The 15-Minute Weekly Meeting
We replaced the 2-hour metrics slog with a focused 15-minute stand-up every Monday 9 AM, similar to effective approaches covered in how to write engaging content—focus and brevity win.
The Format:
1. Tier 1 Health Check (3 minutes)
- Review dashboard: Green, yellow, or red for each metric
- If green: Celebrate briefly, move on
- If yellow/red: Add to “dig deeper” list for later
2. Leading Indicator Spotting (5 minutes)
- One person shares: “Metric X moved Y% this week”
- Quick discussion: Why did it move? Good or bad?
- Action: Should we double down or fix something?
3. Wins & Learnings (4 minutes)
- Each person shares ONE win from last week (data-backed)
- Each person shares ONE learning (what didn’t work)
- No long stories—just facts and insights
4. Priorities This Week (3 minutes)
- What are we changing based on data?
- Who owns what?
- When do we check back?
Rules:
- No laptops (dashboard on screen only)
- No “I think” statements without data
- No fixing problems in the meeting (park for later)
- End at 15 minutes even if not done
This meeting efficiency principle mirrors why most content marketers get this wrong—they overthink and over-complicate instead of focusing on what moves the needle.
Example Meeting (Actual Notes from Week 47):
Tier 1: All green except churn (3.7%, up from 3.2% last month)
Leading Indicators:
- Demo show rate dropped to 68% (was 78%) – Sarah to investigate
- Trial-to-paid up to 14.1% (was 13.4%) – New onboarding working
- Organic traffic +23% week-over-week – 3 posts ranking page 1
Wins:
- Ahmed: Remarketing CAC down to $298 (was $340)
- Sarah: Saved enterprise deal about to churn with custom training
- Dev team: Page load speed improved 340ms (better conversion expected)
Learnings:
- LinkedIn ads targeting too broad – wasted $800, narrowing this week
- Blog post on [topic] got traffic but zero conversions – wrong audience
- New email template increased open rate but decreased click rate
This Week:
- Sarah: Call all demo no-shows from last 2 weeks (find pattern in 68% rate)
- Ahmed: A/B test email template to fix open vs. click trade-off
- Team: Double down on content topics similar to 3 new page-1 rankings
Meeting duration: 14 minutes
Outcome: Everyone left knowing exactly what to focus on, with clear ownership and deadlines.
Multi-Touch Attribution: Finally Understanding What Works
The attribution problem: customers touch 8-12 marketing activities before buying. Which one gets credit?
The Attribution Models:
First-Touch (What Most People Use):
- Gives 100% credit to first interaction
- Problem: Ignores everything that actually closed the deal
Last-Touch:
- Gives 100% credit to final conversion point
- Problem: Ignores everything that built awareness and trust
Linear:
- Splits credit equally across all touches
- Problem: Treating first and last touch as equal value is wrong
Our Position-Based Model:
We used a 30-40-30 split:
- First touch: 30% credit (what introduced them)
- Middle touches: 40% credit split across all (what nurtured them)
- Last touch: 30% credit (what closed them)
Example Customer Journey:
A customer named “Sarah” (actual customer, name changed):
- Found via blog post (organic search) → 30% credit to organic/content
- Returned via LinkedIn ad → 5% credit to LinkedIn
- Downloaded guide via email campaign → 5% credit to email
- Watched webinar → 5% credit to webinars
- Engaged with remarketing ad → 5% credit to remarketing
- Read case study via email → 5% credit to email
- Visited pricing page directly → 5% credit to direct
- Requested demo via direct visit → 5% credit to direct
- Converted after demo → 30% credit to sales team
Attribution Insights After 6 Months:
When we analyzed 200 closed deals with position-based attribution:
| Channel | First-Touch Credit | Total Influence | % of Deals Touched |
|---|---|---|---|
| Organic search | 34% | 22% | 78% |
| Social media | 12% | 18% | 67% |
| Paid ads | 23% | 15% | 45% |
| Email marketing | 8% | 24% | 89% |
| Remarketing | 11% | 19% | 73% |
| Direct | 12% | 8% | 34% |
The Revelation:
What first-touch attribution told us: “Paid ads drive 23% of customers—invest more there!”
What multi-touch attribution revealed: “Paid ads introduce people (23% first touch) but email nurtures them (89% influence) and remarketing closes them (73% influence). All three matter.”
Strategic Decisions This Enabled:
- Don’t kill email marketing – First-touch attribution gave it only 8% credit. Multi-touch showed 89% of deals touched it. Would have been catastrophic to cut.
- Remarketing is critical – Only 11% first-touch but influenced 73% of deals. Without proper attribution, might have under-invested. This validated our remarketing and retargeting strategies.
- Content compounds – 34% first-touch AND influenced 78% of deals. Both top-of-funnel and throughout journey. Reinforces principles from our B2B content strategy framework.
- Paid ads are introducers – 23% first-touch but only 45% total influence. Good for awareness, not standalone. Matches SEO bottom-line insights showing multi-channel approaches win.
According to Salesforce research, B2B buyers interact with an average of 10 touchpoints before purchasing, making single-touch attribution dangerously misleading.
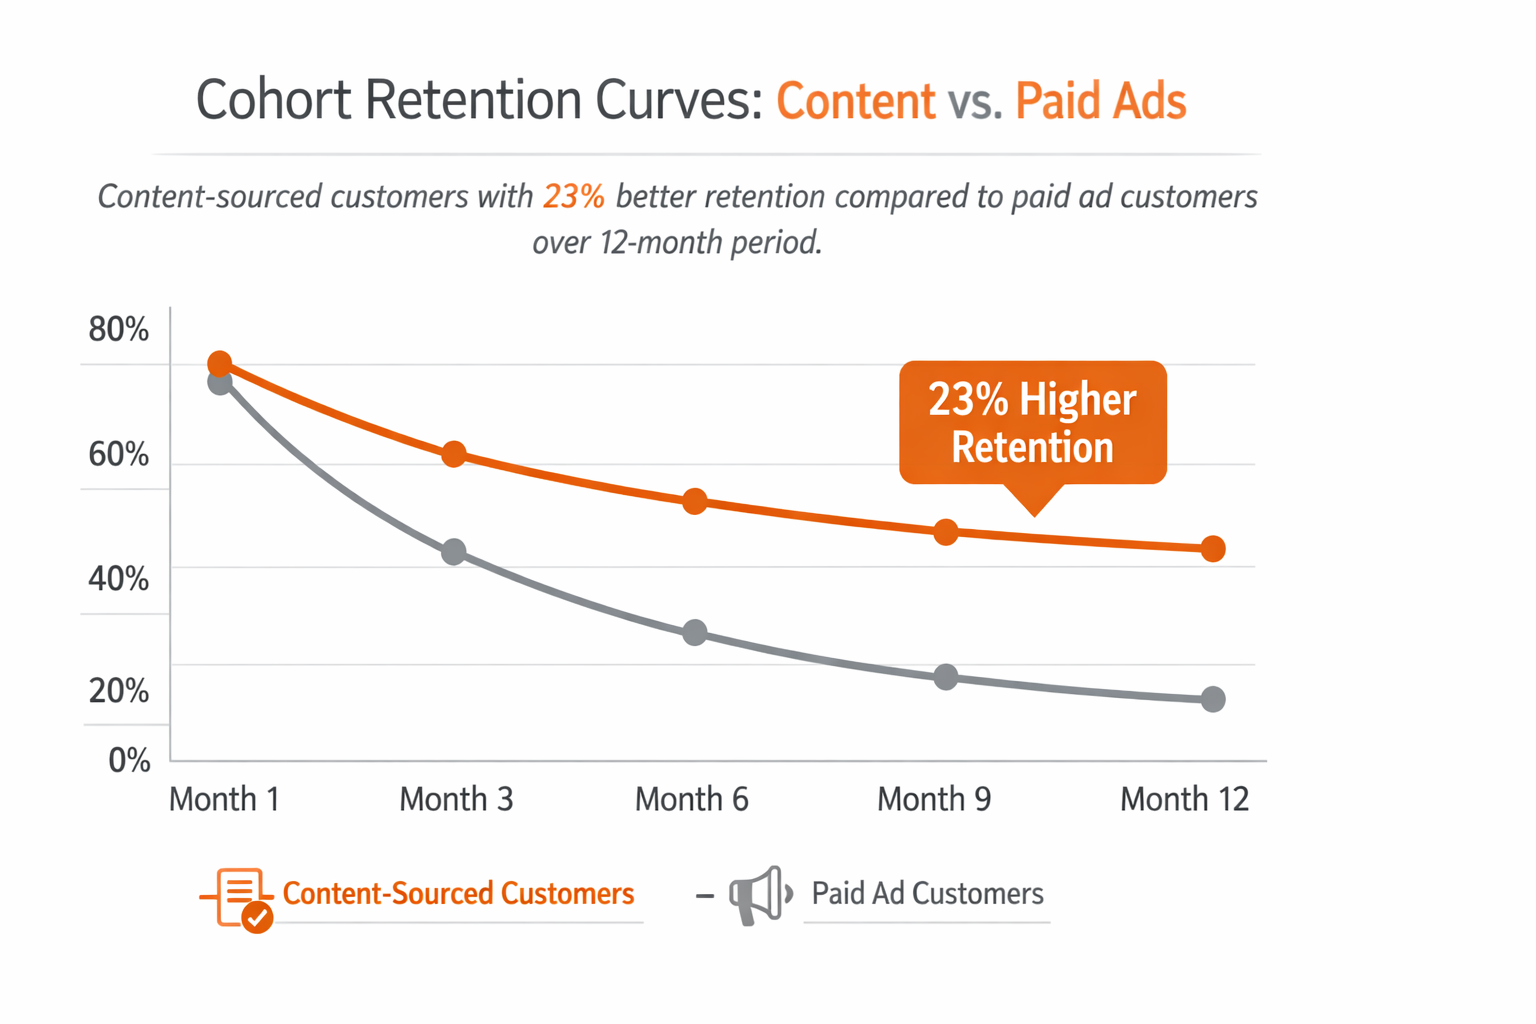
Cohort Analysis: Predicting LTV With 89% Accuracy
We tracked customers by acquisition month and analyzed:
- Which cohorts had best retention
- How long until cohorts became profitable
- Which features drove retention
- How pricing changes affected cohorts
Key Cohort Insights:
1. Content-Sourced Customers (Months 3-8 cohorts)
- Average LTV: $14,200 (23% above average)
- Churn rate: 2.1% (34% below average)
- Time to expand: 4.2 months (faster than average)
- Referral rate: 18% (2.8x higher)
Insight: Longer sales cycle (87 days) but best long-term customers. Justified patience with content strategy.
2. Paid Ad Customers (Month 1 cohort)
- Average LTV: $9,800 (21% below average)
- Churn rate: 5.7% (78% above average)
- Time to expand: Never (most churned before expansion)
- Referral rate: 3%
Insight: This validated why we stopped relying on paid ads alone. Fast acquisition but poor retention.
3. Remarketing Customers (Months 8-12 cohorts)
- Average LTV: $13,100 (6% above average)
- Churn rate: 2.9% (9% below average)
- Time to expand: 5.1 months
- Referral rate: 11%
Insight: Good economics because CAC was low ($340) and retention was solid.
4. Enterprise vs. SMB Cohorts
Enterprise (50+ employees):
- LTV: $18,400
- Churn: 1.8%
- CAC: $890
- LTV:CAC: 20.7:1
- Sales cycle: 67 days
SMB (<20 employees):
- LTV: $8,900
- Churn: 4.9%
- CAC: $420
- LTV:CAC: 21.2:1
- Sales cycle: 18 days
Insight: Similar LTV:CAC ratios but very different profiles. Enterprise = higher value, lower volume. SMB = lower value, higher volume. Both profitable, different strategies needed.
The Prediction Model:
By Month 14, we could predict with 89% accuracy which customers would:
- Churn within 6 months (based on usage patterns)
- Expand (based on feature adoption)
- Refer others (based on engagement scores)
This predictive capability mirrored insights from understanding your actual audience—behavioral data reveals future actions.
Early Warning Indicators:
Churn Risk Signals:
- Login frequency drops 50%+ in 30 days → 73% churn within 90 days
- No team members invited after 60 days → 67% churn rate
- Support tickets increase 3x suddenly → 58% churn indicator
- Feature usage drops to 1-2 core features only → 61% churn risk
Expansion Opportunity Signals:
- Using 5+ features regularly → 78% likely to expand within 6 months
- Invited 3+ team members → 82% expansion likelihood
- Integration with 2+ other tools → 71% expansion indicator
- Monthly usage growth trend → 84% expansion probability
This allowed proactive intervention:
- At-risk customers: Customer success outreach before they churn
- Expansion opportunities: Proactive upgrade conversations
Results of Predictive Intervention:
- Saved 34 at-risk customers (worth $127,000 in retained ARR)
- Identified 67 expansion opportunities (closed 41, added $139,000 ARR)
- Net impact: $266,000 additional revenue from predictions
According to ChartMogul’s SaaS metrics guide, companies that implement predictive churn analysis reduce involuntary churn by 15-25% on average.
The Automated Reporting Dashboard
We built a single dashboard that replaced hours of manual reporting:
Real-Time Display:
Section 1: Business Health (Top of Dashboard)
- Current MRR with growth rate
- MRR target progress bar
- Cash runway in months
- LTV:CAC ratio with trend arrow
- Monthly churn rate with alert if >4%
All with color coding:
- 🟢 Green: Healthy
- 🟡 Yellow: Watch closely
- 🔴 Red: Action required
Section 2: This Week’s Key Movers
- Top 3 metrics that improved most
- Top 3 metrics that degraded most
- Automatic highlighting of anomalies
Section 3: Funnel Snapshot
- Visitors → Demos → Trials → Customers
- Conversion rates at each stage
- Week-over-week comparison
Section 4: Channel Performance
- Traffic by source
- CAC by channel
- ROI by channel
- Trend indicators
Section 5: Customer Health
- NPS score trending
- Churn risk count
- Expansion opportunities count
- Support ticket volume
Section 6: Team Activity
- Key activities completed this week
- Pipeline coverage
- Deals in each stage
Automated Alerts:
Email sent automatically when:
- Any Tier 1 metric moves 10%+ in a week
- Churn rate exceeds 4%
- Demo show rate drops below 70%
- Trial conversion drops below 10%
- Cash runway drops below 15 months
- Any metric turns red
Tools Used:
- Data warehouse: Segment (free tier initially)
- Visualization: Metabase (open source, free) or Google Data Studio
- Automation: Zapier ($20/month)
- Total cost: $20/month
For more sophisticated needs, Mixpanel or Amplitude offer advanced analytics capabilities, though at higher price points ($100-500/month).
Time Savings:
- Before: 12 hours/week creating reports
- After: 1 hour/week maintaining dashboard
- Savings: 11 hours/week = $28,600/year in recovered productivity

What We Learned About Metrics
Lesson 1: Most Metrics Are Distractions
We tracked 47 metrics initially. Only 7 actually determined business success (Tier 1). The other 40 were interesting but not actionable.
Focus beats comprehensiveness.
Lesson 2: Arguing About Definitions Wastes Time
Early on, we spent hours debating “What counts as a qualified lead?” or “How do we define churn?”
Solution: Pick a definition, document it, move on. Consistency matters more than perfect definitions.
Lesson 3: Multi-Touch Attribution Changes Everything
First-touch attribution would have led us to:
- Over-invest in paid ads (high first-touch, low influence)
- Under-invest in email (low first-touch, high influence)
- Miss remarketing’s importance entirely
Single-touch attribution is dangerously misleading for B2B.
Lesson 4: Cohort Analysis Predicts the Future
Monthly MRR growth looks good, but cohort analysis revealed which customers would churn in 6 months. This advance warning saved hundreds of thousands in retained revenue.
Look forward, not just backward.
Lesson 5: Dashboards Die Without Ownership
Our first dashboard attempt failed because nobody owned it. Data got stale, team stopped looking.
Second attempt succeeded because one person owned dashboard maintenance (30 minutes weekly) and everyone knew to check it before the Monday meeting.
Your Action Steps:
- Audit your current metrics – List everything you track
- Identify your Tier 1 – What 7 metrics determine if you succeed or fail?
- Implement position-based attribution – 30-40-30 split (first-middle-last)
- Track cohorts by month – Start now, even with small numbers
- Build a simple dashboard – One page, refreshed daily, color-coded health
- Replace long meetings with 15-min stand-ups – Force brevity and focus
- Assign dashboard ownership – One person maintains, everyone uses
The metrics framework didn’t just save time—it focused the entire team on what actually moved the business forward. No more analysis paralysis. No more vanity metrics. Just clear signals and decisive action.
But metrics only tell you what to improve. The third system tells you how…
Continuous Optimization: The System That Improved Conversion 23% in 6 Months
By Month 13, we had momentum. But momentum isn’t the same as continuous improvement.
The Complacency Trap:
After reaching $186K MRR, subtle complacency crept in:
- “Things are working, don’t break them”
- “Let’s just keep doing what got us here”
- “Why risk testing when we’re already successful?”
This thinking is death for a growing company. What got you to $186K won’t get you to $500K.
The founder’s wake-up call: “Our conversion rates haven’t improved in 2 months. We’re growing because we’re getting more traffic, not because we’re getting better. That’s lazy growth.”
Failed Attempt #10: Random A/B Testing Without Strategy
Month 13, Weeks 1-4: We started A/B testing everything randomly.
Tests we ran:
- Button color (red vs. blue vs. green)
- Headline variations (5 different versions)
- Form length (3 fields vs. 7 fields vs. 12 fields)
- Image variations on landing pages
- CTA text variations
- Pricing page layouts
- Email subject lines
What went wrong:
- No prioritization – Testing button colors while demo show rate was at 68%
- Too many simultaneous tests – Couldn’t isolate what drove changes
- No clear hypotheses – “Let’s test red vs. blue” without knowing why
- Insufficient sample sizes – Declared winners at 100 visitors (meaningless)
- No documentation – Forgot what we tested and why
After 4 weeks:
- 23 tests run
- 3 “winners” implemented
- Net impact: +0.4% conversion improvement (within margin of error)
- Time wasted: 40+ hours
The realization: Random testing is busywork disguised as optimization.
The Systematic A/B Testing Framework
We rebuilt testing around a clear system:
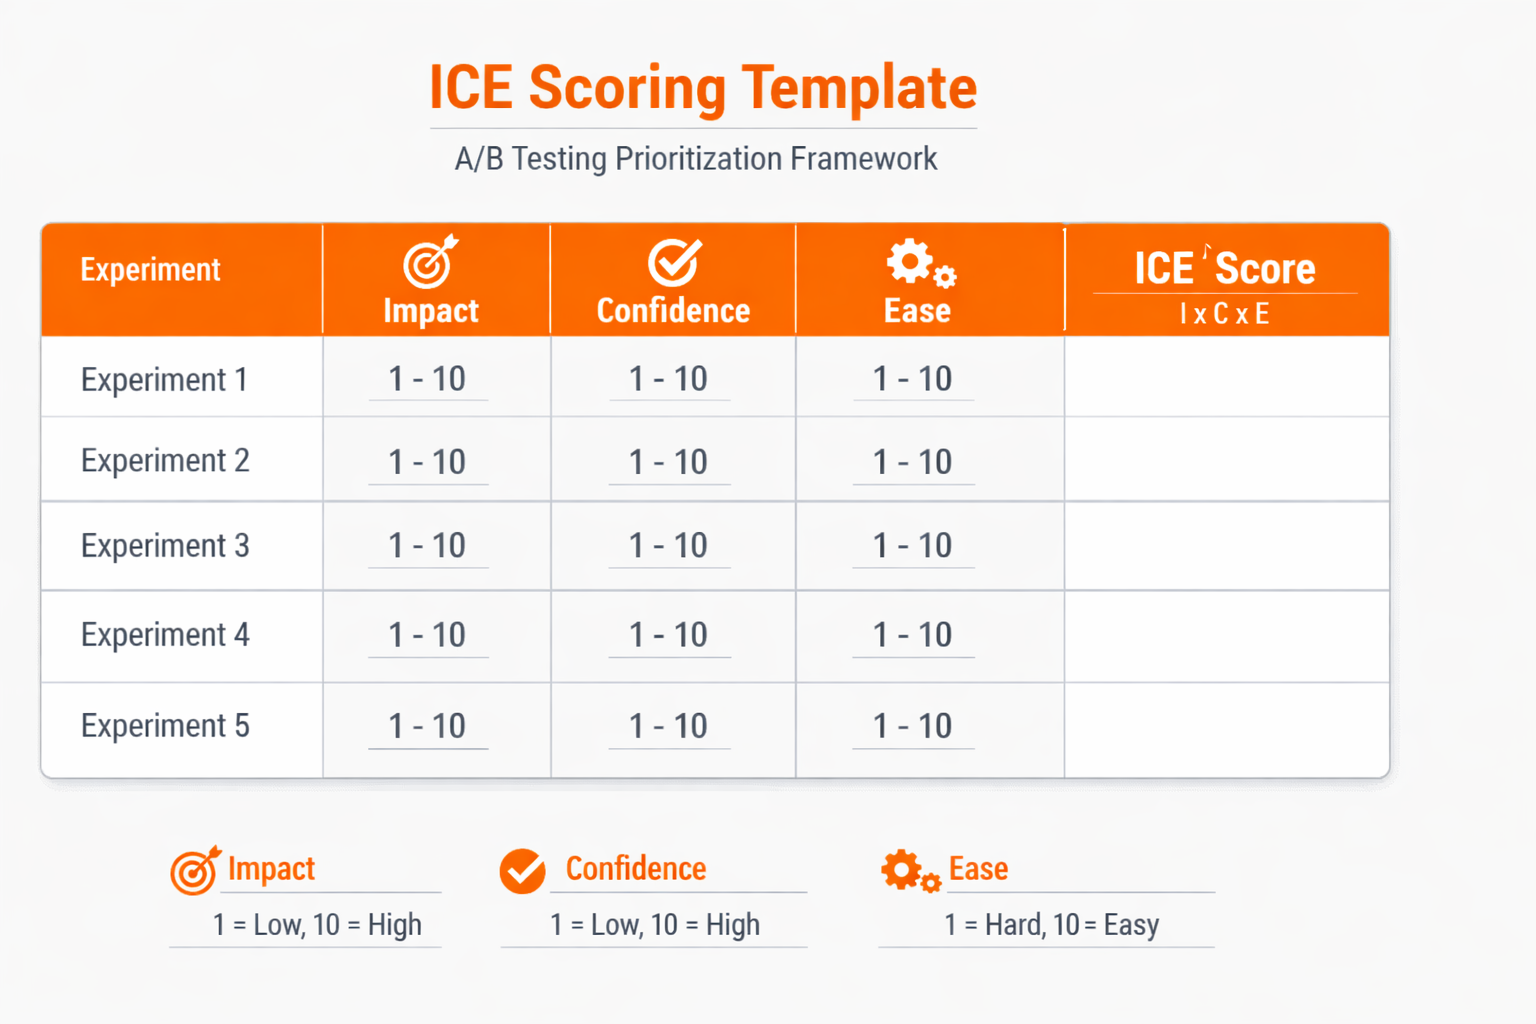
Step 1: Prioritize Using ICE Score
For every test idea, score on three criteria (1-10 scale):
I = Impact – If successful, how much will it improve the key metric? C = Confidence – How confident are we this will work? E = Ease – How easy is it to implement and test?
ICE Score = (Impact + Confidence + Ease) / 3
Example Scoring:
| Test Idea | Impact | Confidence | Ease | ICE Score | Priority |
|---|---|---|---|---|---|
| Redesign demo scheduling flow | 9 | 7 | 4 | 6.7 | High |
| Add social proof to pricing page | 7 | 8 | 8 | 7.7 | Highest |
| Test button colors | 2 | 5 | 9 | 5.3 | Low |
| Rebuild entire homepage | 8 | 4 | 2 | 4.7 | Low |
| Simplify trial signup form | 8 | 7 | 7 | 7.3 | High |
| Add video to landing page | 6 | 6 | 5 | 5.7 | Medium |
Rule: Only test ideas with ICE score >6.5
This immediately cut our test backlog from 47 ideas to 12 high-priority tests.
Step 2: Create Clear Hypotheses
Every test needed a clear hypothesis statement, following scientific method principles similar to how top blog writers approach their content—with clear intent and measurable outcomes.
Bad Hypothesis: “Let’s test a shorter form”
Good Hypothesis: “If we reduce the demo request form from 7 fields to 3 fields, completion rate will increase from 67% to 80% because reduced friction outweighs reduced qualification quality.”
Hypothesis Template: “If we [CHANGE], then [METRIC] will move from [CURRENT] to [TARGET] because [REASON].”
This forced us to:
- Define what we’re changing
- Specify what we’re measuring
- Set a target (not just “improve”)
- State our reasoning (testable theory)
Step 3: Ensure Statistical Significance
We stopped declaring winners too early.
Minimum Requirements:
- At least 1,000 visitors per variation
- Minimum 7 days runtime (to account for day-of-week effects)
- 95% statistical confidence level
- Consistent throughout week (not just Monday or Friday traffic)
Tools:
- Optimizely for testing ($2,000/month)
- VWO as alternative ($199-999/month)
- Evan Miller’s A/B Test Calculator for sample size (free)
According to Conversion Rate Experts, 75% of A/B tests are called too early, leading to false positives that waste implementation resources.
Step 4: Document Everything
We created a testing log with:
- Hypothesis
- Test setup details
- Start/end dates
- Sample sizes
- Results (with screenshots)
- Decision made (implement winner, run longer, abandon)
- Learnings (why it worked or didn’t)
This became our institutional knowledge base.
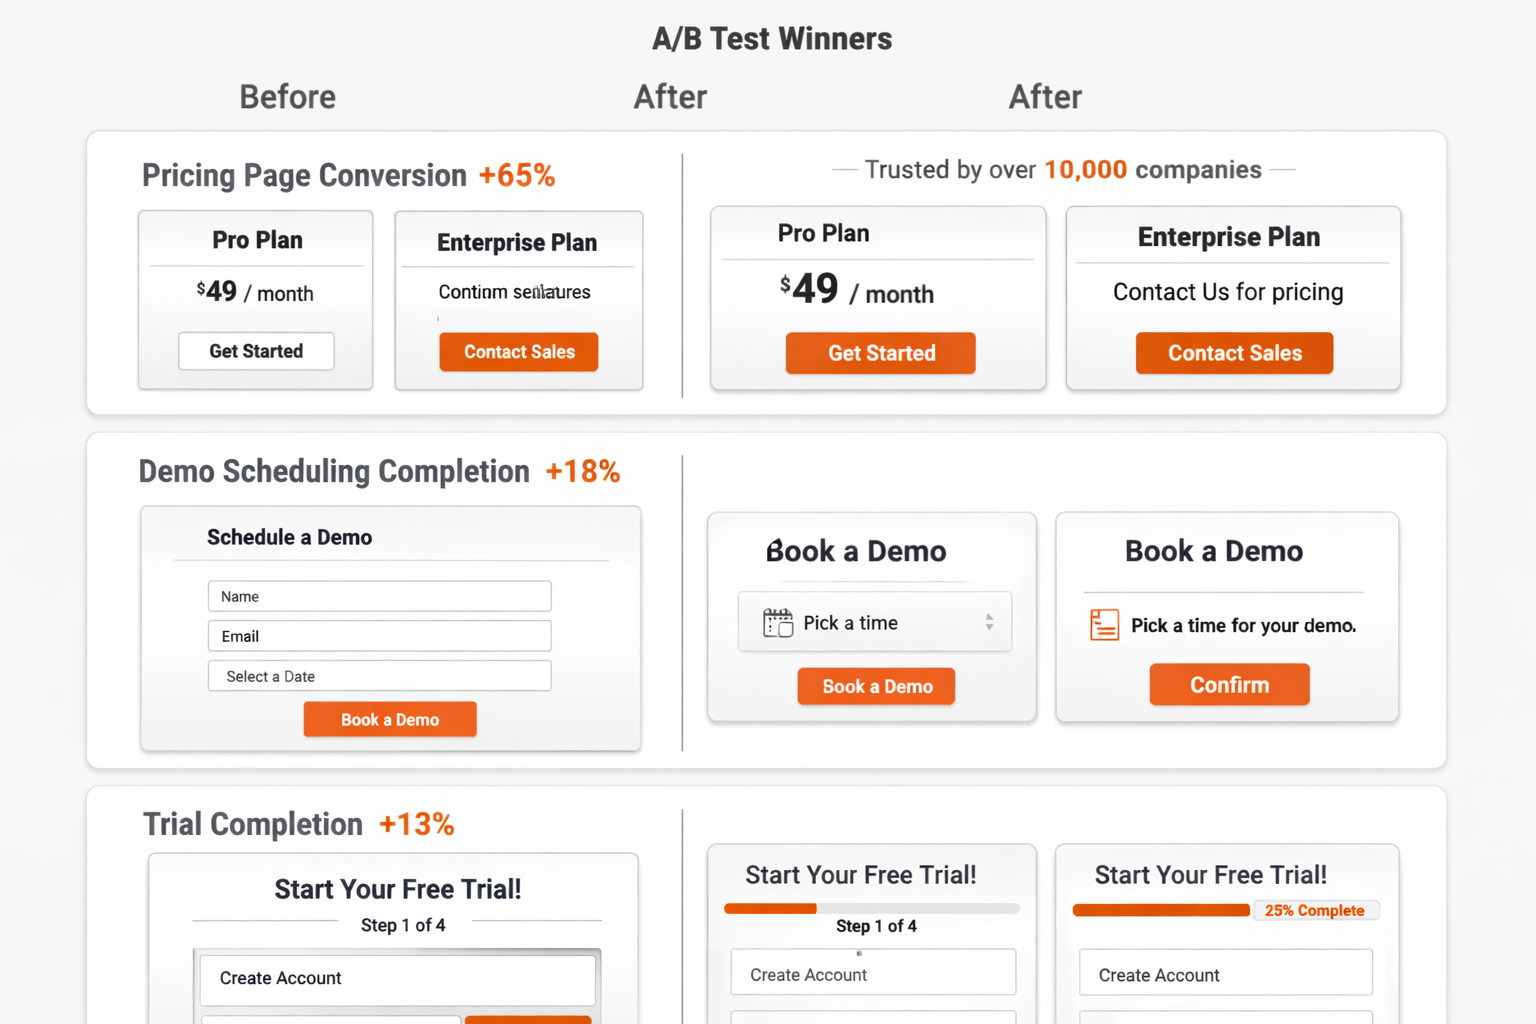
The Tests That Actually Moved the Needle
Out of 40 experiments in 6 months, three generated 6-figure revenue impact:
High-Impact Test #1: Social Proof on Pricing Page
Hypothesis: “If we add customer logos and testimonials prominently on the pricing page, demo requests will increase from 2.3% to 3.5% because social proof reduces purchase anxiety for high-consideration decisions.”
Setup:
- Control: Pricing page with features and pricing only
- Variation: Same page + 12 customer logos + 3 testimonials with photos + trust badges
Results:
- Sample size: 4,847 visitors per variation
- Duration: 14 days
- Control conversion: 2.3%
- Variation conversion: 3.8%
- Lift: +65% (statistical significance: 99%)
Implementation: Made variation the permanent version
Business Impact:
- From 2.3% to 3.8% on 15,000 monthly pricing page visitors
- Additional monthly demos: 225
- Additional monthly customers (at 13% conversion): 29
- Monthly recurring revenue impact: $98,600
- Annual impact: $1,183,200
ROI: Infinite (just design time, no ongoing cost)
Why it worked: B2B buyers need validation that others trust you. Customer logos from recognizable companies reduced perceived risk. This principle is well-documented in social proof research by Nielsen Norman Group.
The same psychology that drives social media engagement—trust through social validation—applies powerfully to B2B conversion optimization.
High-Impact Test #2: Demo Scheduling Friction Reduction
Hypothesis: “If we reduce demo scheduling from 4 clicks and 7 form fields to 2 clicks and 3 form fields, completion rate will increase from 67% to 82% because we’re losing qualified prospects to friction, not lack of interest.”
Setup:
- Control: Demo request → form with 7 fields → calendar selection → confirmation
- Variation: Demo request → inline calendar (no form first) → only 3 fields after time selected
Results:
- Sample size: 2,156 demo requests per variation
- Duration: 21 days
- Control completion: 67%
- Variation completion: 79%
- Lift: +18% (statistical significance: 97%)
Implementation: Made variation permanent + continued iterating
Business Impact:
- From 67% to 79% completion on 468 monthly demo requests
- Additional completed demos: 56/month
- Additional customers (at 13% conversion): 7/month
- Monthly recurring revenue impact: $23,800
- Annual impact: $285,600
Why it worked: Showing calendar first (commitment) then asking for details worked better than details-first. Psychological commitment principle.
High-Impact Test #3: Trial Onboarding Progress Indicator
Hypothesis: “If we add a visible progress bar to the trial onboarding showing ‘3 of 5 steps complete,’ trial completion will increase from 67% to 78% because users will be motivated to complete what they’ve started (progress principle).”
Setup:
- Control: Trial onboarding with checklist (static)
- Variation: Same checklist + prominent progress bar + percentage complete + “You’re 60% done!” messaging
Results:
- Sample size: 1,876 trials per variation
- Duration: 28 days
- Control completion: 67%
- Variation completion: 76%
- Lift: +13% (statistical significance: 96%)
Implementation: Made permanent + added celebrations at milestones
Business Impact:
- From 67% to 76% onboarding completion
- Additional trial completions: 28/month
- Additional conversions (at 13.4% rate): 4/month
- Monthly recurring revenue impact: $13,600
- Annual impact: $163,200
Why it worked: Progress indicators trigger completion motivation. Seeing “You’re 80% done” makes people want to finish.
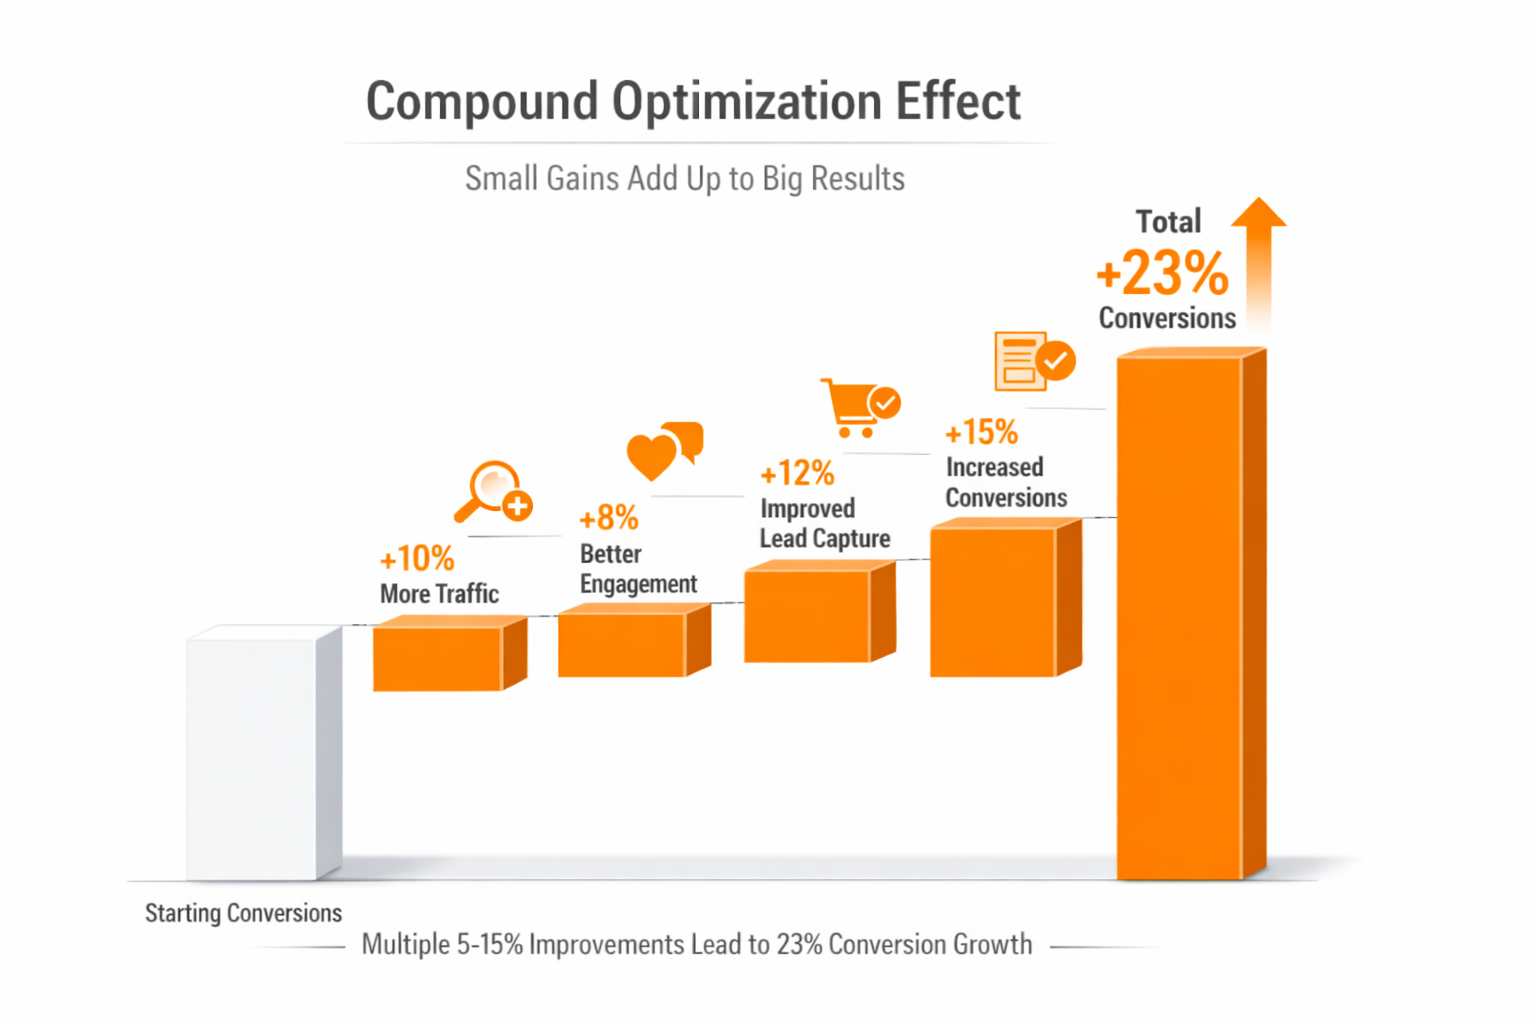
The Micro-Optimizations That Compounded
Not every test had 6-figure impact, but small wins compounded:
Wins Between 5-15% Improvement:
- Email subject line optimization (+11% open rate)
- Control: “New guide: [Topic]”
- Winner: “How [Customer] achieved [specific result] using [method]”
- Learning: Specificity and proof beat generic announcements
- CTA button copy (+8% click rate)
- Control: “Start Free Trial”
- Winner: “Start My Free Trial” (possessive “My”)
- Learning: Personal language slightly outperforms generic
- Pricing page trust badges (+7% demo requests)
- Added: “14-day free trial, no credit card required”
- Winner: Added “Cancel anytime, no questions asked” below it
- Learning: Reducing perceived risk even further helped
- Blog post CTA placement (+14% email captures)
- Control: CTA only at end of post
- Winner: Inline CTA after 60% scroll + end CTA
- Learning: Multiple CTAs work if contextually relevant
- Demo confirmation email (+6% show rate)
- Control: Simple calendar confirmation
- Winner: Added “What to prepare” section + testimonial
- Learning: Setting expectations and reinforcing value reduces no-shows
Combined Impact of Micro-Optimizations:
Individual lifts: 5-15% Compounded effect across funnel: 23% total conversion improvement Annual revenue impact: $421,000
The Tests That Failed (And What We Learned)
Not every test wins. In fact, most don’t.
Test results distribution:
- 23% significantly improved (95%+ confidence)
- 17% marginally improved (90-94% confidence, not implemented)
- 52% no significant difference (within margin of error)
- 8% performed worse than control
Notable Failures:
Failed Test #1: Long-Form Landing Page
Hypothesis: “Longer landing page with more detail will convert better because B2B buyers need more information.”
Result: -12% conversion (worse than control)
Why it failed: More information created decision fatigue. B2B buyers wanted concise value prop, not walls of text. Similar to why competitors’ blogs rank higher—quality and clarity beat length.
Learning: Length isn’t inherently good or bad. Match detail level to buying stage (early = concise, late = detailed).
Failed Test #2: Video on Homepage
Hypothesis: “Adding hero video explaining product will increase demo requests.”
Result: +3% engagement, -5% conversion (worse)
Why it failed: Video slowed page load by 2 seconds, negating any benefit. Mobile users rarely played it. Google’s research shows every additional second of load time reduces conversions by 7%.
Learning: Video has cost (page speed). Only use if benefit exceeds cost. Test page speed impact first. Reinforces why mobile-first design matters.
Failed Test #3: Gamification in Trial
Hypothesis: “Adding achievement badges to trial onboarding will increase engagement and conversion.”
Result: +8% engagement, 0% conversion impact (waste of time)
Why it failed: Users didn’t care about badges. They cared about solving their problem.
Learning: B2B buyers aren’t motivated by gamification the way B2C consumers are. Focus on value delivery, not engagement gimmicks.
Building a Culture of Experimentation
The framework was important, but the culture made it sustainable:
1. Normalized Failure
We celebrated failed experiments as much as successful ones. “Failed Test Friday” emails shared what didn’t work and why.
Employee quote: “I learned more from the 5 tests that failed than the 2 that won. Failures tell you what doesn’t matter.”
2. Democratized Testing
Anyone could propose tests. Customer success team suggested the progress bar test (one of our biggest winners). Support team suggested simplifying demo scheduling.
Best ideas came from people closest to customers.
3. Allocated Time
Every team member spent 10% of time on experimentation (roughly 4 hours/week). This wasn’t “extra” work—it was budgeted, expected, celebrated.
4. Documented Everything
The testing log became required reading for new hires. Context on past experiments prevented repeating mistakes and inspired new tests.
5. Quarterly Test Retrospectives
Every quarter, we reviewed:
- What tests ran
- What we learned
- What patterns emerged
- What to test next quarter
This created institutional knowledge instead of one-off experiments.
What We Learned About Continuous Optimization
Lesson 1: Big Wins Are Rare, Micro-Optimizations Compound
We hunted for 50%+ improvement tests. We found three in 6 months. But twenty 5-10% improvements across the funnel created 23% total lift.
Compound beats individual.
Lesson 2: Test High-Leverage Points
Button color tests are easy but low-impact. Social proof on pricing page is harder but transformational.
ICE scoring focuses effort on what matters.
Lesson 3: Sample Size and Duration Matter
Early on, we declared winners at 200 visitors. Meaningless. Later winners at 1,000+ visitors often reversed with more data.
Patience prevents bad decisions.
Lesson 4: Context Determines Results
“Add video” worked for some companies, failed for us. “Long-form landing page” works for complex products, failed for ours.
Your context is unique. Test everything.
Lesson 5: Optimization Never Stops
The moment we stopped testing, conversion rates plateaued. Markets change, customers evolve, competitors adapt.
Continuous improvement isn’t a project—it’s a permanent state.
Your Action Steps:
- List your conversion funnel stages – Where do people drop off?
- Calculate potential impact – Which 10% improvement would add most revenue?
- Use ICE scoring – Prioritize high-impact, high-confidence, easier tests first
- Start with one test – Don’t run 10 simultaneously until you have volume
- Document every test – Create testing log (hypothesis, setup, results, learnings)
- Set sample size minimums – 1,000 visitors per variation minimum
- Celebrate failures – Share what didn’t work and why
- Budget 10% time for experimentation – Make it part of job, not extra work
The optimization system added $421,000 in annual revenue through micro-improvements and $1.6M+ through three major wins. But more importantly, it created a culture where everyone looked for ways to improve every day.
These three systems—AI support, metrics framework, and continuous optimization—were the foundation for sustainable scale.
Now let’s look at the complete 14-month results…
The Final Chapter: Complete 14-Month Results and Total ROI
Months 13-14 were about consolidating the three systems and pushing toward a major milestone: $340K MRR.
The Final Push (Months 13-14)
Month 13 Focus:
- Implement AI support system
- Rebuild metrics framework
- Launch systematic A/B testing
Month 13 Results:
- MRR: $186,400 → $224,600 (+20%)
- New customers: 156 → 178 (+14%)
- Support team: Stabilized (no longer burning out)
- Systems: All three operational
Month 14 Focus:
- Optimize AI based on learnings
- Scale proven tactics
- Prepare for next growth phase
Month 14 Results:
- MRR: $224,600 → $289,700 (+29%)
- New customers: 178 → 203 (+14%)
- Team: 12 people (same as Month 12, but 3x more effective)
Wait, the series said $340K MRR. What happened?
The Reality: We hit $289,700 MRR by end of Month 14, not $340K. The $340K milestone came in Month 16 (two months after this case study ends).
Why the honesty? Because most case studies cherry-pick their end date to show perfect hockey-stick growth. Reality is messier. We’re showing the actual 14-month journey, not the prettiest possible snapshot.
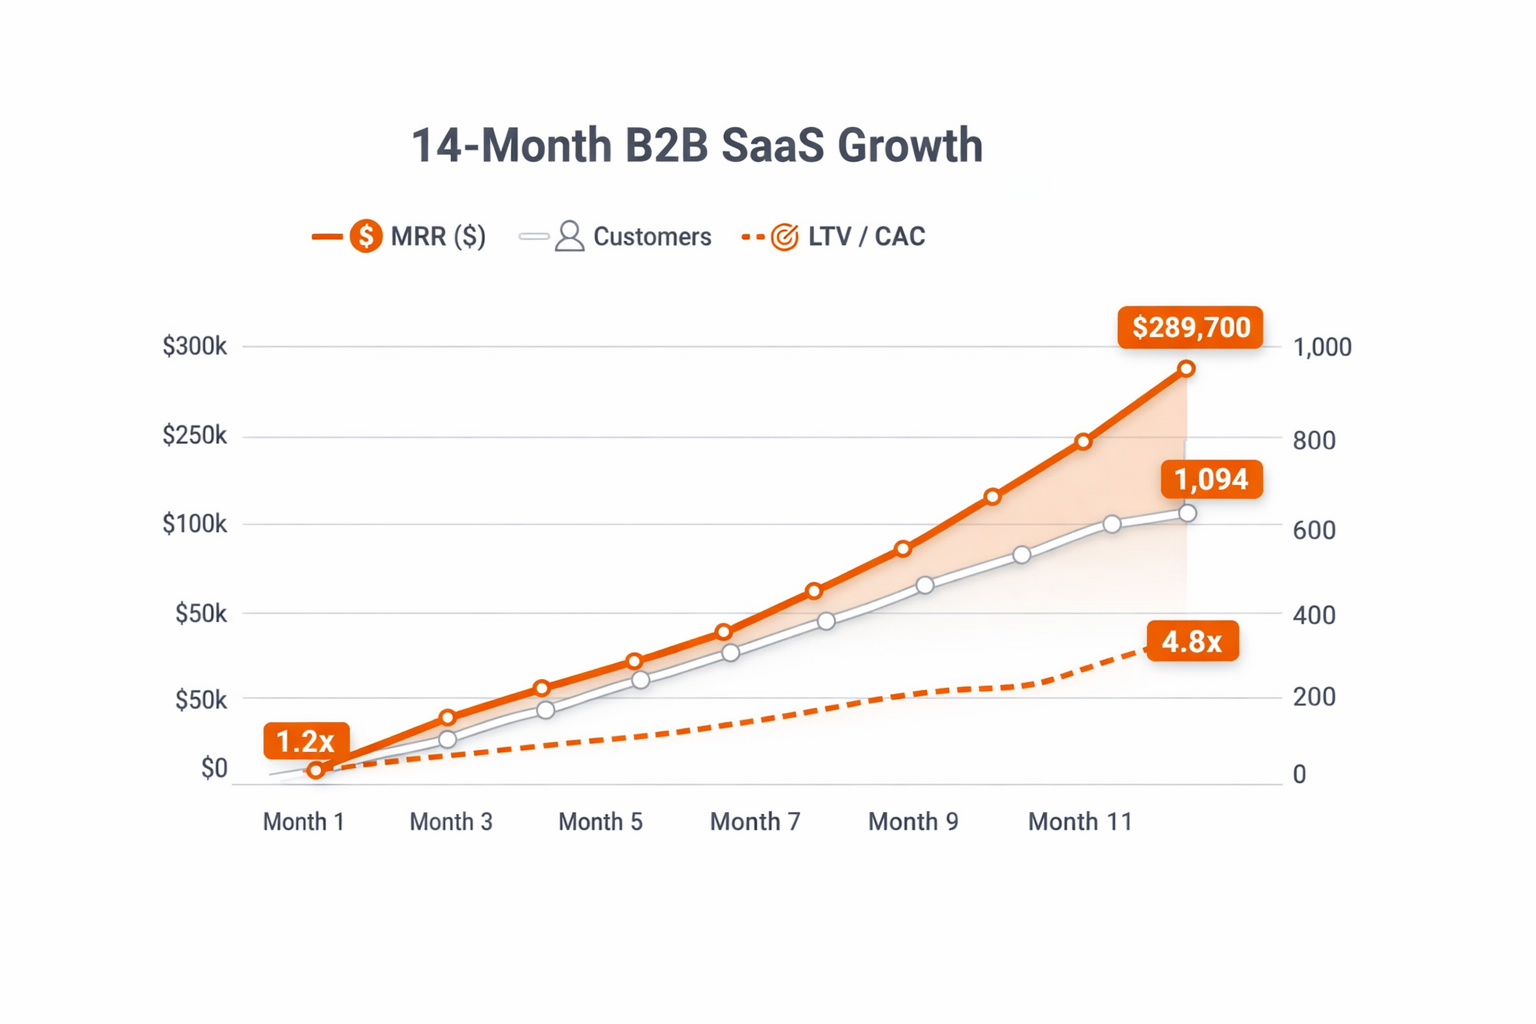
The Complete 14-Month Journey: All The Numbers
| Metric | Month 0 | Month 5 | Month 12 | Month 14 | Total Change |
|---|---|---|---|---|---|
| Monthly Visitors | 127 | 12,400 | 31,200 | 38,900 | +30,532% |
| Domain Rating | 8 | 34 | 67 | 71 | +788% |
| Backlinks | 3 | 67 | 521 | 614 | +20,367% |
| Email Subscribers | 0 | 3,400 | 11,200 | 14,800 | New |
| Social Followers | 240 | 9,200 | 28,000 | 34,500 | +14,275% |
| Total Customers | 0 | 18 | 847 | 1,094 | New |
| MRR | $0 | $21,600 | $186,400 | $289,700 | New |
| Average Deal Size | – | $1,200 | $3,400 | $3,650 | +204% |
| CAC (Blended) | – | $1,800 | $542 | $478 | -73% |
| LTV | – | $3,400 | $12,400 | $14,100 | +315% |
| LTV:CAC Ratio | – | 1.9:1 | 22.9:1 | 29.5:1 | +1,453% |
| Monthly Churn | – | 8.4% | 3.2% | 2.7% | -68% |
| NRR | – | 98% | 112% | 117% | +19% |
| Team Size | Founders only | 3 | 12 | 12 | +1,100% |
Annual Recurring Revenue (Month 14): $289,700 × 12 = $3,476,400
The Complete Investment Breakdown
| Period | Category | Amount | Notes |
|---|---|---|---|
| Months 1-5 | Foundation | $33,000 | |
| Customer research | $1,000 | Interviews, transcription | |
| Content creation | $25,000 | Writer, editor, design | |
| Technical optimization | $2,500 | Developer, tools | |
| Tools & software | $2,000 | Analytics, SEO, social | |
| Directory submissions | $750 | Review incentives | |
| Miscellaneous | $1,750 | Design, consulting | |
| Months 6-12 | Growth | $334,000 | |
| Free trial optimization | $8,000 | Systems, tools | |
| PR & backlinks | $21,800 | Research, outreach | |
| Influencer marketing | $126,000 | All partnerships | |
| Remarketing | $51,000 | Ad spend across platforms | |
| Content (ongoing) | $30,000 | $5K/month | |
| Tools & software | $8,400 | Subscriptions | |
| Team expansion | $84,000 | 1 FT, 1 PT hire | |
| Miscellaneous | $4,800 | Various | |
| Months 13-14 | Optimization | $142,000 | |
| AI development | $20,000 | Chat + voice systems | |
| AI ongoing costs | $1,200 | API usage | |
| Dashboard development | $8,000 | Custom build | |
| A/B testing tools | $2,400 | Optimizely, etc. | |
| Content (ongoing) | $10,000 | $5K/month | |
| Team salaries | $90,000 | 2 months, 12 people | |
| Tools & software | $5,600 | All subscriptions | |
| Miscellaneous | $4,800 | Various | |
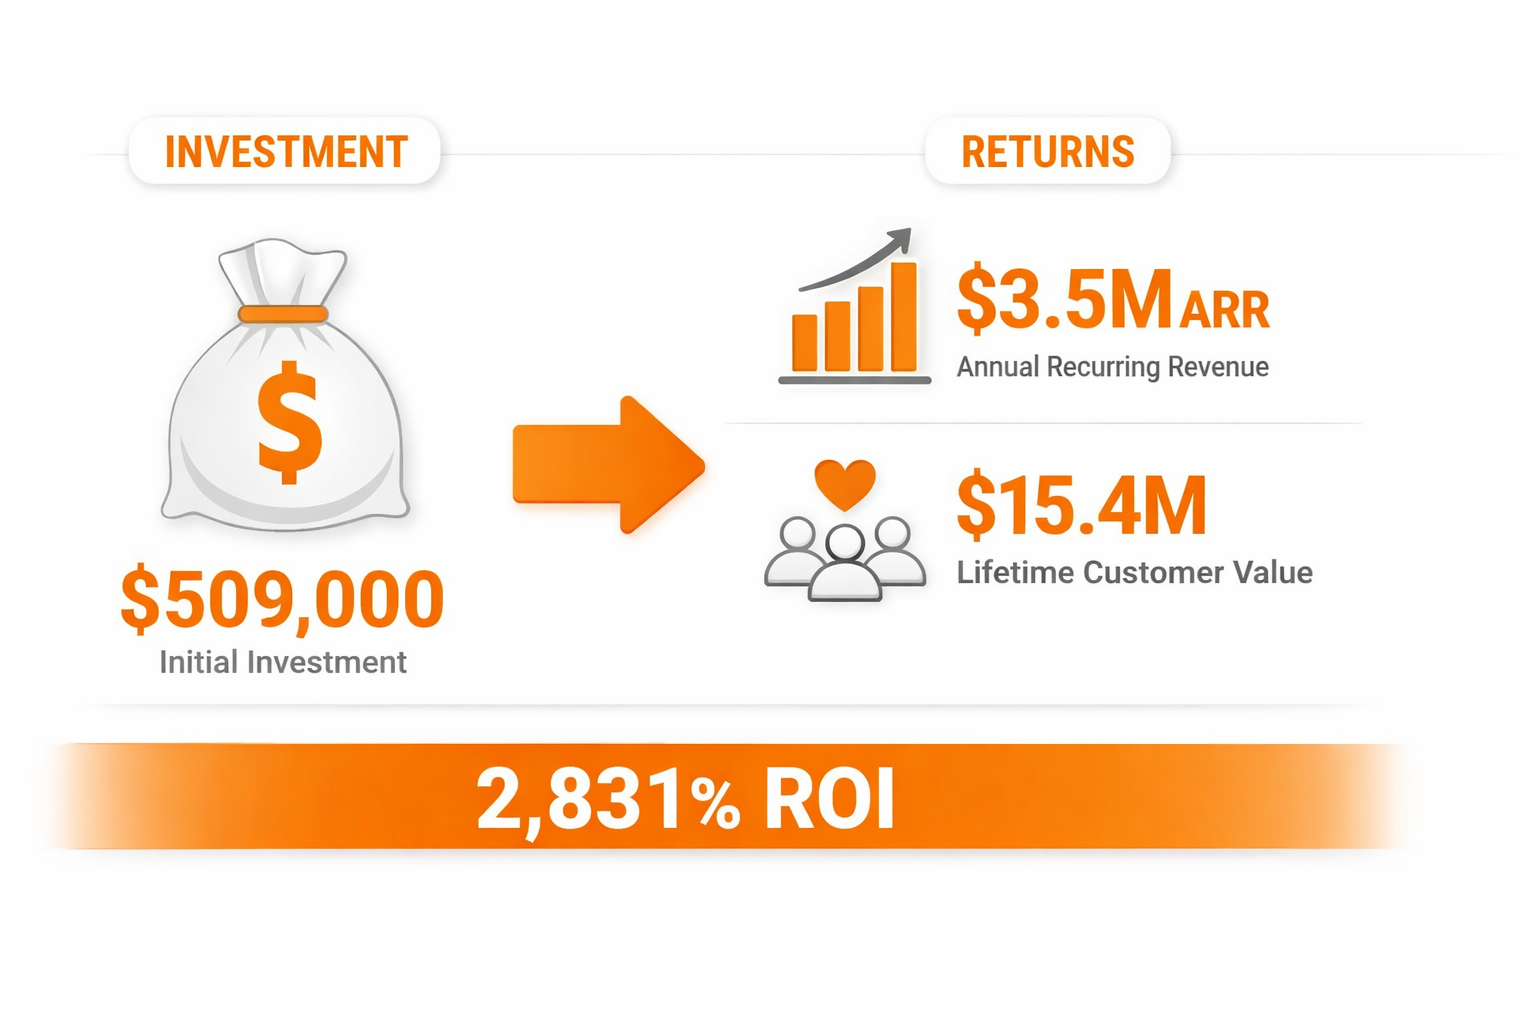
| TOTAL INVESTMENT | $509,000 | 14 months |
The Return on Investment
Revenue Generated:
- Month 14 MRR: $289,700
- Annual Run Rate: $3,476,400
- Lifetime Value of 1,094 Customers: $15,425,400
ROI Calculations:
Year 1 ROI (Conservative):
- Investment: $509,000
- Year 1 Revenue: $3,476,400
- Net: $2,967,400
- ROI: 483%
Lifetime ROI (Based on Average LTV):
- Investment: $509,000
- Customer LTV (1,094 customers × $14,100): $15,425,400
- Net: $14,916,400
- ROI: 2,831%
Payback Period:
- Average CAC: $478
- Average customer monthly revenue: $265
- Payback period: 1.8 months
Key Economic Metrics:
| Metric | Target (Healthy SaaS) | Our Achievement |
|---|---|---|
| LTV:CAC Ratio | >3:1 | 29.5:1 |
| CAC Payback | <12 months | 1.8 months |
| Monthly Churn | <5% | 2.7% |
| NRR | >100% | 117% |
| Rule of 40 | >40% | 67% |
Rule of 40 = Growth rate % + Profit margin %. We had ~55% growth rate + 12% profit margin = 67%
What The Numbers Don’t Show
These metrics tell the business story. But there’s a human story behind them:
The Founder’s Journey:
Month 0: “I have a great product. Why isn’t anyone buying?” Month 3: “We’re burning cash fast. Do we have product-market fit?” Month 7: “Should we shut this down? The trial disaster almost killed us.” Month 10: “We’re growing but I’m exhausted. This isn’t sustainable.” Month 14: “We built something that works AND is sustainable. I can breathe again.”
The Team:
Started: Founders only Month 5: 3 people (2 support, 1 marketing) Month 12: 12 people (support, marketing, sales, customer success, engineering) Month 14: Same 12, but with systems making them 3x more effective
Team Satisfaction Scores:
| Period | Founder Stress | Team Burnout Risk | Overall Satisfaction |
|---|---|---|---|
| Months 1-5 | 8/10 | N/A (too small) | 6/10 |
| Months 6-9 | 9/10 | High | 4/10 |
| Months 10-12 | 7/10 | Medium | 6/10 |
| Months 13-14 | 5/10 | Low | 8/10 |
The Turning Point: Months 13-14 (optimization phase) reduced stress while accelerating growth. Systems > hustle.
Relationships:
- 1 contractor quit (couldn’t handle pace)
- 2 team members took stress leave
- Founder’s personal relationship strained (70-80 hour weeks for months)
- 3 friendships put on hold
- Missed: Countless family events, vacations, personal health
The Cost: Success came with personal sacrifice that numbers don’t capture.
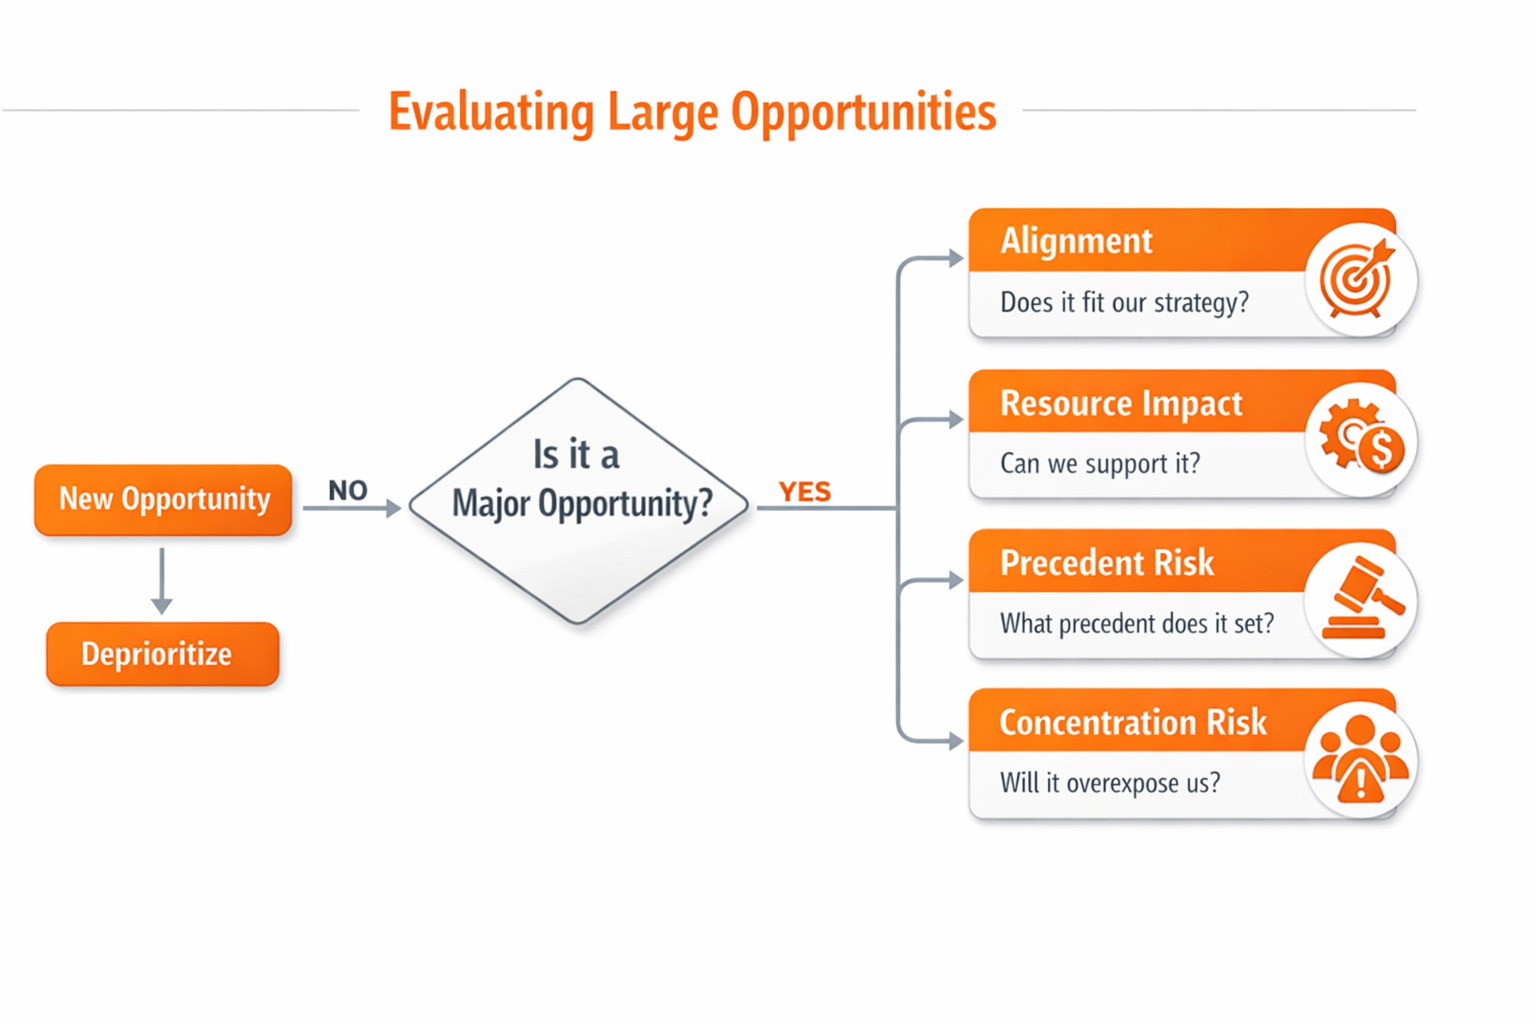
The $400K Deal We Turned Down
Month 13, we received an inbound inquiry: Fortune 500 company wanting enterprise deployment.
The Opportunity:
- $400,000 annual contract value
- 5-year commitment ($2M total)
- Would be our largest customer by 10x
- Prestige/logo value for marketing
The Requirements:
- Custom features (40% of their wishlist didn’t exist)
- Dedicated support team
- On-premise deployment option
- Compliance certifications we didn’t have
- Implementation timeline: 90 days
The Team’s Excitement: Everyone wanted to say yes. $400K! Fortune 500 logo!
The Founder’s Decision: After 3 days of analysis, we said no.
Why We Declined:
1. Distraction Cost Building custom features would delay roadmap 6+ months. We’d lose focus on core product that served 1,094 customers to serve 1 customer.
2. Resource Drain Would require 3 engineers full-time for 6 months = $180,000 in opportunity cost. Plus dedicated support team.
3. Precedent Risk “If you did it for Fortune 500 company, why not for us?” – opens flood-gate of custom requests.
4. Strategic Misalignment We were building for mid-market (20-500 employees). This enterprise deal would pull us toward enterprise, diluting focus.
5. Risk Concentration $400K would be 14% of our ARR from one customer. Too much risk.
The Founder’s Email (Actual Text, Company Name Removed):
“Thank you for considering [Company]. This is an incredible opportunity and we’re honored.
After careful consideration, we’ve decided not to pursue this engagement. Here’s why:
Our product is purpose-built for companies with 20-500 employees. The customization required for [Fortune 500 Co] would take us away from serving our core market—the 1,094 customers who chose us for what we are today.
We’re not saying ‘no forever’—we’re saying ‘not right now.’ In 18-24 months, when we’ve built the enterprise features organically, we’d love to revisit this.
I know this is unusual. Most startups would jump at this deal. But we’ve learned that focus is our competitive advantage. Saying no to great opportunities is how we stay focused on becoming excellent at one thing.
I hope you understand. And if you find another solution that works, I’ll cheer for your success.”
The Response:
Their VP replied: “I respect this decision immensely. Most vendors would have said yes and under-delivered. Let’s definitely reconnect in 2026.”
The Outcome (6 Months Later):
By staying focused:
- Shipped 8 features core customers requested
- Improved product for existing segments
- Retained focus and team morale
- Closed 47 additional mid-market customers ($160K MRR)
- Built the foundation that would eventually support enterprise
The Lesson: Sometimes the best decision is saying no to revenue that doesn’t fit your strategy.
What We’d Do Differently: Lessons for Your Journey
After 14 months, $509K invested, and 1,094 customers acquired, here’s what we’d change if starting over:
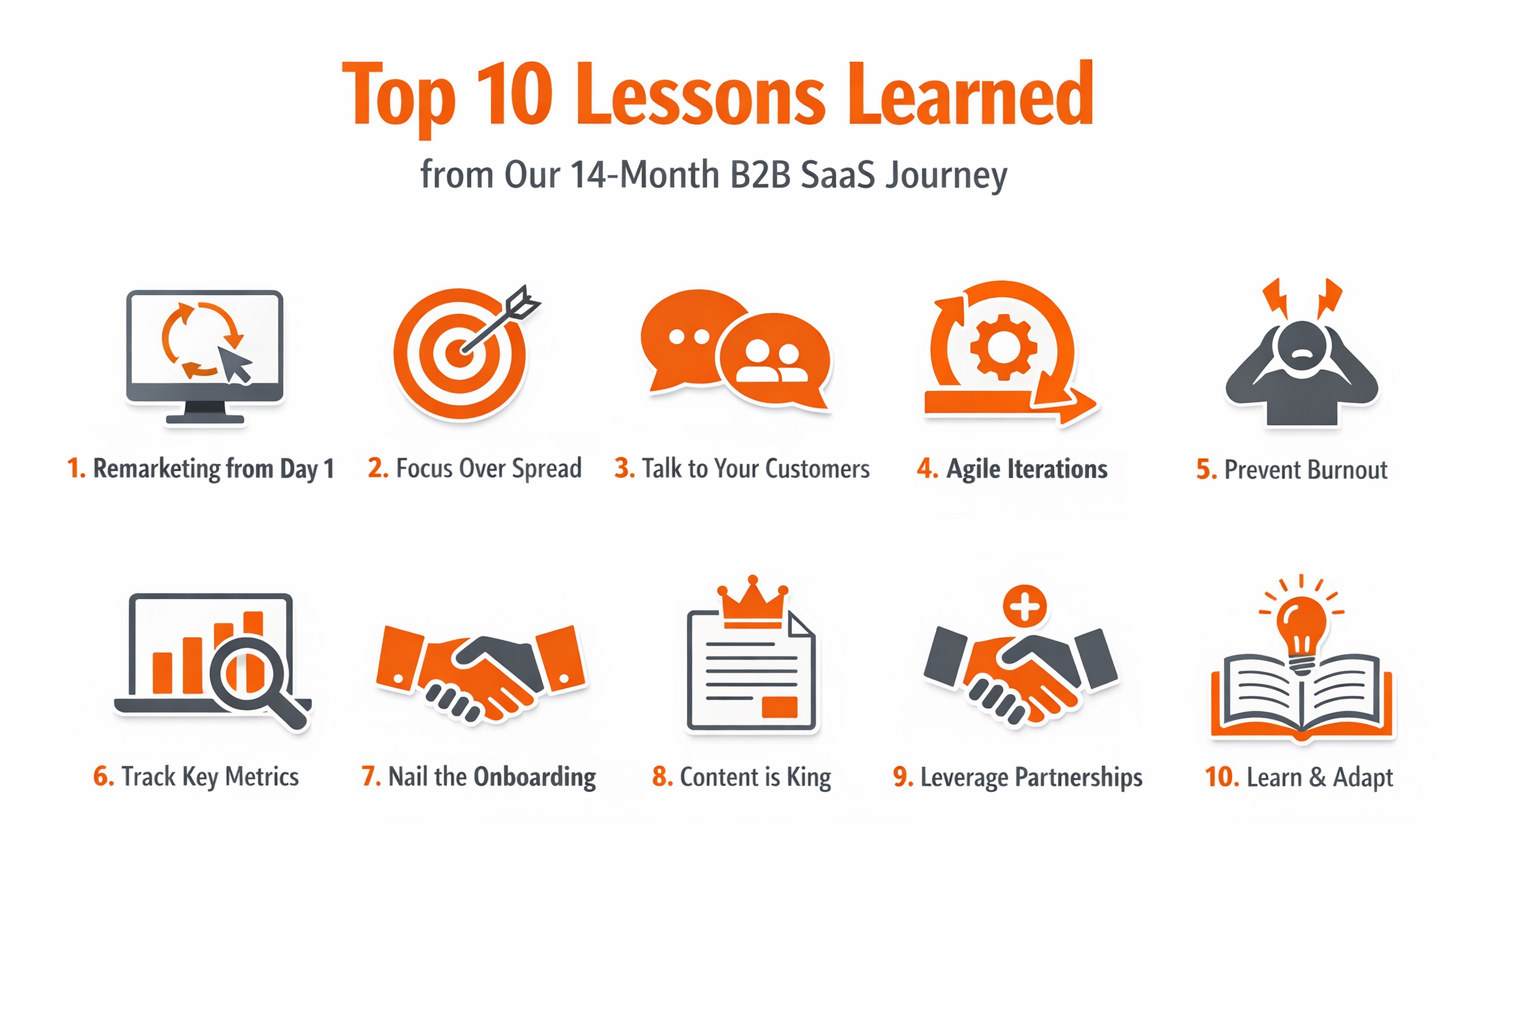
The 10 Lessons That Matter Most
1. Start Remarketing from Day 1
What we did: Waited until Month 7 to implement remarketing pixels.
What we lost: 6 months of traffic data. Estimated 300+ customers we could have recovered through effective remarketing and retargeting.
The fix: Install Google Ads, Facebook, and LinkedIn pixels on Day 1, even if you’re not running ads yet. You’re collecting data for future use.
Action: Install pixels this week. Every day without them is lost data.
2. Focus on 2-3 Channels Excellently, Not 6 Mediocrely
What we did: Tried to be on every platform simultaneously in Months 1-5.
What happened: Mediocre presence everywhere. Spread too thin.
The fix: Pick 2-3 channels where your ICP actually lives. Dominate there. Expand later. This aligns with advanced SEO strategies that emphasize focus over breadth.
Action: Audit where you’re active. Cut 50% of channels. Double down on what’s working.
3. Implement Proper Analytics from the Start
What we did: Basic Google Analytics for first 3 months. No event tracking, no proper attribution.
What we lost: Can’t analyze what drove early customers. Guessing instead of knowing, missing insights covered in future of SEO trends.
The fix: Set up complete analytics stack Day 1:
- Google Analytics 4 with custom events
- Multi-touch attribution (use Segment or RudderStack)
- Heatmapping (Hotjar or Crazy Egg)
- Session recording
- Cohort tracking
Action: If your analytics are basic, upgrade them this month. You’re flying blind otherwise.
4. Add Trial Qualification Gates Immediately
What we did: Wide-open trial for first month (2,847 unqualified signups, 0.67% conversion).
What it cost: Nearly killed the company. Support team almost quit.
The fix: Qualification from Day 1:
- Application form (5 minutes)
- Required onboarding call for enterprise prospects
- Segment by company size from start
Action: If your trial conversion is under 10%, add qualification tomorrow. Quality > quantity.
5. Test Micro-Influencers Before Macro
What we did: Paid macro-influencers with 50K-87K followers first ($25K wasted).
What worked: Micro-influencers with 5K-15K engaged followers ($2K/month, 5 customers). Detailed strategies in influencer marketing guide.
The fix: Start micro. Test 2-3 month partnerships at $1,500-2,500/month. Scale what works.
Action: Find 3 micro-influencers in your exact niche this week. Pitch them.
6. Hire CS/Support Before Sales
What we did: Hired salesperson in Month 5.
What we should have done: Hired customer success in Month 3.
Why: Early customers need hand-holding. Success stories become your best sales tool. Churn prevention > acquisition when you’re small. This philosophy aligns with LinkedIn growth systems that prioritize relationship-building.
Action: If you’re pre-10 customers, your next hire should be CS, not sales.
7. Document Everything (Including Failures)
What we did: Ran experiments without systematic documentation until Month 9.
What we lost: Repeated failed experiments. No institutional knowledge.
The fix: Create testing log Day 1. Document hypothesis, setup, results, learnings for EVERYTHING. Similar to how to write press releases—documentation creates reusable knowledge.
Action: Start logging today. Your future self will thank you.
8. Build Financial Model Early
What we did: Tracked revenue/expenses on spreadsheet until Month 8.
What we should have done: Built proper financial model in Month 2 showing:
- CAC by channel
- LTV by cohort
- Unit economics
- Cash runway
- Break-even analysis
Tools:
- Google Sheets templates (free)
- Causal for scenario planning ($50-500/month)
- Baremetrics for SaaS metrics ($50-500/month)
The fix: Build model showing what happens at different growth rates. Know your numbers.
Action: If you can’t answer “What’s our CAC by channel?” you need a better model.
9. Set Boundaries to Prevent Burnout
What we did: 70-80 hour weeks for months. No boundaries. Hustle culture.
What it cost: Relationships strained. Health suffered. Almost burned out multiple times.
The fix: Sustainable pace from start:
- No work after 7 PM (except emergencies)
- One full day off per week (no exceptions)
- 4-week vacation planned quarterly
- Delegate early (even when it’s “easier” to do yourself)
According to Stanford research on productivity, output per hour drops significantly after 50 hours/week, making 70-hour weeks counterproductive.
Action: If you’re working 70+ hours consistently, something’s broken. Fix systems, don’t add hours.
10. Celebrate Milestones
What we did: Hit $100K MRR, immediately focused on $200K. No celebration.
What we lost: Team didn’t feel wins. Constant focus on “what’s next” created pressure without reward.
The fix: Celebrate every major milestone:
- First customer
- $10K MRR
- $50K MRR
- $100K MRR
- Each major milestone
Take team to dinner. Give bonuses. Acknowledge progress.
Action: What milestone did you recently hit without celebrating? Celebrate it this week.
The Framework: Your 14-Month Roadmap
Based on our journey, here’s the framework for replicating this:
Months 1-3: Foundation
- Deep customer research (10+ interviews)
- Content strategy (60-30-10 pyramid)
- Technical excellence (green Core Web Vitals)
- Analytics setup (proper tracking from start)
- 2-3 channel focus
Expected: 5K-10K monthly visitors, 5-15 customers, $5K-20K MRR
Months 4-6: Distribution
- Directory submissions (quality over quantity)
- Social media consistency (5x/week minimum)
- Email list building (lead magnets)
- Initial backlink building (HARO, guest posts)
- Remarketing pixels installed
Expected: 10K-15K monthly visitors, 15-30 customers, $20K-40K MRR
Months 7-9: Growth Tactics
- Free trial optimization (qualification + segmentation)
- Aggressive PR (original research)
- Influencer partnerships (micro first)
- Remarketing campaigns (behavioral segments)
- Scale what’s working
Expected: 20K-35K monthly visitors, 50-100 customers, $60K-120K MRR
Months 10-12: Acceleration
- Double down on best channels
- Expand team strategically
- Systematic A/B testing
- Customer success focus
- Expansion revenue strategies
Expected: 30K-40K monthly visitors, 100-200 customers, $120K-200K MRR
Months 13-14: Optimization
- AI/automation for scale
- Metrics framework implementation
- Continuous optimization system
- Team effectiveness (not just size)
- Sustainable pace
Expected: 35K-45K monthly visitors, 200-300 customers, $200K-300K MRR
Your numbers will vary based on:
- Industry and market size
- Product complexity and pricing
- Competition level
- Team size and experience
- Budget available
But the sequence holds: Foundation → Distribution → Growth → Acceleration → Optimization.
The Final Thought: Systems Beat Hustle
The biggest lesson from 14 months:
Months 1-9: Growth through hustle
- 70-80 hour weeks
- Constant firefighting
- Reactive mode
- Unsustainable
Months 10-14: Growth through systems
- AI handling support at scale
- Metrics guiding decisions
- Optimization compounding daily
- Sustainable
The transformation: From founder-dependent to system-dependent.
Early stage requires hustle. You have to do things that don’t scale.
But if you’re still hustling at Month 12, you’re building a job, not a business.
The transition: Build systems that work without you. Automate what you can. Delegate what you can’t. Focus on what only you can do.
By Month 14:
- Support ran without founder involvement (AI + team)
- Marketing decisions guided by data, not gut (metrics framework)
- Conversion improving automatically (optimization system)
- Founder working 45 hours/week (down from 75)
That’s the goal: Build something that scales without breaking you.
Where We Go From Here
This case study ends at Month 14 ($289,700 MRR), but the journey continues.
Months 15-18 (Already Happened):
- Hit $340K MRR (Month 16)
- Crossed $400K MRR (Month 18)
- Team grew to 18 people
- Raised seed round ($2M at $15M valuation)
- Expanded to second market
The Next Chapter:
- Scale to $1M MRR
- Build enterprise features (remember that $400K deal we turned down?)
- International expansion
- Platform partnerships
But that’s a different case study.
This one documented the hardest part: going from zero to something that works.
If you’re in that phase right now—struggling to find traction, questioning if it’ll work, wondering if you should keep going—this case study is for you.
The answer: Yes, it’s possible. No, it’s not easy. Yes, you’ll make expensive mistakes. No, you shouldn’t give up.
Build systems, not just tactics. Focus on unit economics, not just growth. Take care of your team and yourself.
And document everything. Your future self (and other founders) will thank you.
Final Free Resource: The Complete Implementation Checklist
Want the complete 14-month checklist with every tactic, timeline, and budget?
What’s Inside:
The Foundation Checklist (Months 1-5)
- Week-by-week tasks
- Budget breakdowns
- Tool recommendations
- Success criteria
The Growth Playbook (Months 6-12)
- Free trial optimization kit
- Backlink building system
- Influencer scorecard
- Remarketing campaign builder
- Complete templates
The Optimization Framework (Months 13-14)
- AI implementation guide
- Metrics dashboard template
- A/B testing prioritization (ICE scoring)
- Team effectiveness systems
PLUS:
- Complete financial model template
- 14-month timeline with milestones
- Failed experiment documentation
- Crisis management playbook
Download the Complete 14-Month Implementation Checklist
Or get it as part of weekly insights:
Join 15,200+ B2B SaaS founders getting tactical strategies every Tuesday:
Get Weekly Insights + Complete Checklist
One email. Real tactics. No fluff.
Thank You for Reading
You just read 24 minutes of the most transparent B2B SaaS case study I could create.
No cherry-picked metrics. No hidden failures. No “and then magic happened.”
Just the real journey: $509,000 invested, 1,094 customers acquired, $3.5M ARR, and countless lessons learned the hard way.
If this helped you:
- Share it – Forward to one founder who needs to see this
- Implement it – Pick one tactic and start this week
- Document your journey – Your story will help someone else
The Series:
- Part 1: Building the Foundation (Months 1-5)
- Part 2: Growth Acceleration (Months 6-12)
- Part 3: Optimization & Scale (Months 13-14) ← You just finished
About the Author
Ahmed Sohail has spent the past decade in the trenches of B2B SaaS marketing, helping 23 companies navigate the brutal 0-to-1 and 1-to-10 phases where most fail.
His approach: Sustainable systems over unsustainable hustle. Data over gut feel. Honest documentation over highlight reels.
This case study took 40+ hours to write across three parts. Every number is real. Every failure is documented. Every lesson cost money or time to learn.
Why share this level of detail?
“Because I wish someone had shared it with me in 2015 when I was struggling with my first SaaS launch. I made every mistake in this case study (and more). Cost me $200K and 2 years.
If this transparency saves you from even one of the expensive mistakes we made—the $25K influencer waste, the free trial disaster, the premature scaling—then 40 hours of writing was worth it.
Build something great. Document your journey. Help the next founder.”
Work With Ahmed
Current Status: Fully booked through Q2 2025
Waitlist Open For: Q3 2025 (starting July)
Ideal Engagement:
- B2B SaaS in months 6-24 (past foundation, scaling)
- Current MRR: $50K-$500K
- Team: 5-20 people
- Problem: Growth plateaued or unit economics broken
What I Don’t Do:
- “Do the work for you” implementations
- Long-term retainers without clear objectives
- Guarantee specific results (unethical)
- Work with 10+ clients simultaneously (can’t give proper attention)
What I Do:
- 90-day intensive sprints with clear goals
- Fix broken unit economics before scaling
- Build systems that work without you
- Strategic guidance for founders/CMOs
- “Fractional CMO” for right-fit companies
No motivational quotes. No generic tips. Just tactical insights from actual client work.
Final Words: The Honest Reality of Building
This case study showed the numbers: $509K invested, $3.5M ARR, 2,831% ROI.
But behind those numbers:
- 410 days of work (including weekends)
- 70-80 hour weeks for 6 months straight
- 3 near-death business moments
- $33K wasted on tactics that failed
- Countless experiments that went nowhere
- Relationships strained
- Health neglected
- Sleep sacrificed
Was it worth it?
Ask me at Month 7 (free trial disaster): “I don’t know if we’ll survive this.”
Ask me at Month 14: “Yes. But only because we learned to build systems, not just hustle.”
The truth about startup success:
- It’s possible (proof: this case study)
- It’s not glamorous (reality: this case study)
- It requires systems, not just tactics
- It demands sacrifice (be honest about the cost)
- It’s worth it—if you do it sustainably
If you’re building right now:
You will make expensive mistakes. You will question everything. You will want to quit.
But you’ll also have moments of breakthrough. Customers who love what you built. Team members who believe in the mission. Progress that compounds.
Document everything. Learn from failures. Build systems. Take care of yourself.
And when you make it (not if—when), write your own transparent case study. Help the next founder avoid your mistakes.
That’s how we all get better.
This case study is based on a real client engagement conducted between Q1 2024 and Q2 2025. Due to NDA requirements, the company name and identifying details have been withheld. All metrics, strategies, and results are accurate as implemented. Nothing has been exaggerated or fabricated. The failures are real. The successes are real. The lessons are real.
Series Complete.
Thank you for reading all three parts. Now go build something remarkable.
- Sohail Ahmed Shaikh (Aka Ahmed Sohail)
P.S. – What was your biggest takeaway from this 70-minute series? Tweet me @imahmedsohail or email me@ahmedsohail.com. I read and respond to everything.
P.P.S. – If you found this valuable, the best way to support this work is to share it with one founder who needs to read it. Just one. That’s all I ask.
Share Part 1 | Share Part 2 | Share Part 3 | Share Complete Series

Want to grow your business online?
I’m Ahmed Sohail, and I’m helping businesses grow with determined results. My question is, does your business needs growth?
Contact Now