
No Ads. No Audience. 847 Users in 90 Days — Here’s What We Built First (Part 1)
Dec 31, 2025 | By Ahmed Sohail
Part 1 of 3 in the series: From Zero to 847 Enterprise Clients
How we built a repeatable marketing foundation before scaling anything else- Series Navigation
| Part | Focus | Status |
|---|---|---|
| Part 1: Building the Foundation | Content, Technical, Distribution, Social | ← You Are Here |
| Part 2: Growth Acceleration | Trials, PR, Influencers, Remarketing | Coming Next |
| Part 3: Optimization & Scale | AI, Metrics, Continuous Improvement | Final Chapter |
Reading Time: 17 minutes | Key Lessons: 4 Major Strategies + 3 Failed Attempts | Money Wasted: $18,000 (so you don’t have to)
What You’ll Learn in Part 1
When a promising B2B SaaS incubator approached me in Q1 2024, they had a solid product but zero market presence. Due to our signed NDA, I can’t reveal their name, but I can share every strategy, failure, and breakthrough that took them from complete obscurity to their first wave of customers.
This isn’t your typical sanitized success story. In this first part alone, we failed three times before finding what worked. We wasted $18,000 on tactics that bombed. But those failures taught us more than any early win ever could.
In this article, you’ll discover:
What’s Inside:
- Why we wasted $15,000 on paid ads in month 1 (and what we did instead)
- The content strategy that generated 89 demo requests in month 6
- How we improved Core Web Vitals by 78% and increased conversions by 156%
- The directory submission that drove 347 leads vs. the 127 that drove zero
- How we built social presence from 240 to 8,945 followers on LinkedIn alone
- The exact frameworks, costs, and timelines for everything
By the end of Part 1, you’ll have the complete foundation blueprint to start generating your first qualified leads—even with zero brand recognition.
Let’s start with where most B2B SaaS companies begin: nowhere.
Table of Contents
The Starting Point: A Product in Search of an Audience

Let me be brutally honest. When this B2B SaaS company came to me, they had built something genuinely innovative. Their platform solved a critical workflow problem for enterprise teams. But here’s what they didn’t have: brand awareness, website traffic, or a clear understanding of who their actual audience was.
The Initial Landscape
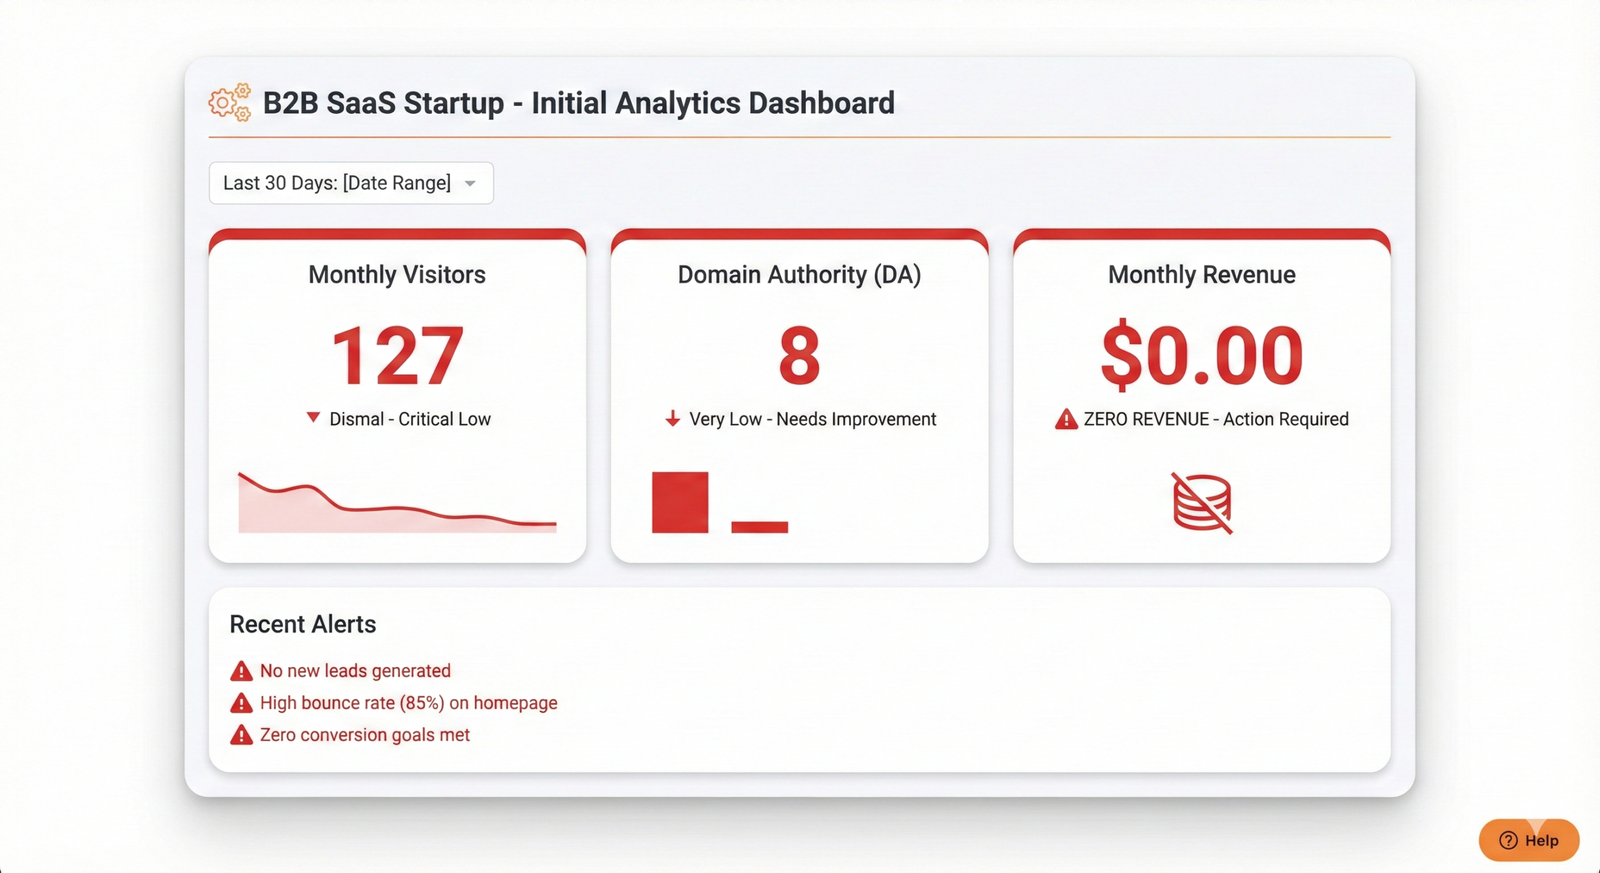
The Numbers That Made Us Wince:
- Website traffic: 127 monthly visitors (mostly employees and their families)
- Domain Authority: 8 out of 100
- Backlinks: 3 (two from their founder’s personal blog)
- Social media followers: Combined 240 across all platforms
- Monthly Recurring Revenue: $0
- Runway: 9 months
Failed Attempt #1: The $15,000 Spray-and-Pray Disaster
Like many founders, they initially believed that if they just got in front of enough people, conversions would follow. Their logic seemed sound:
“We have a great product. We just need visibility. Let’s buy some ads.”
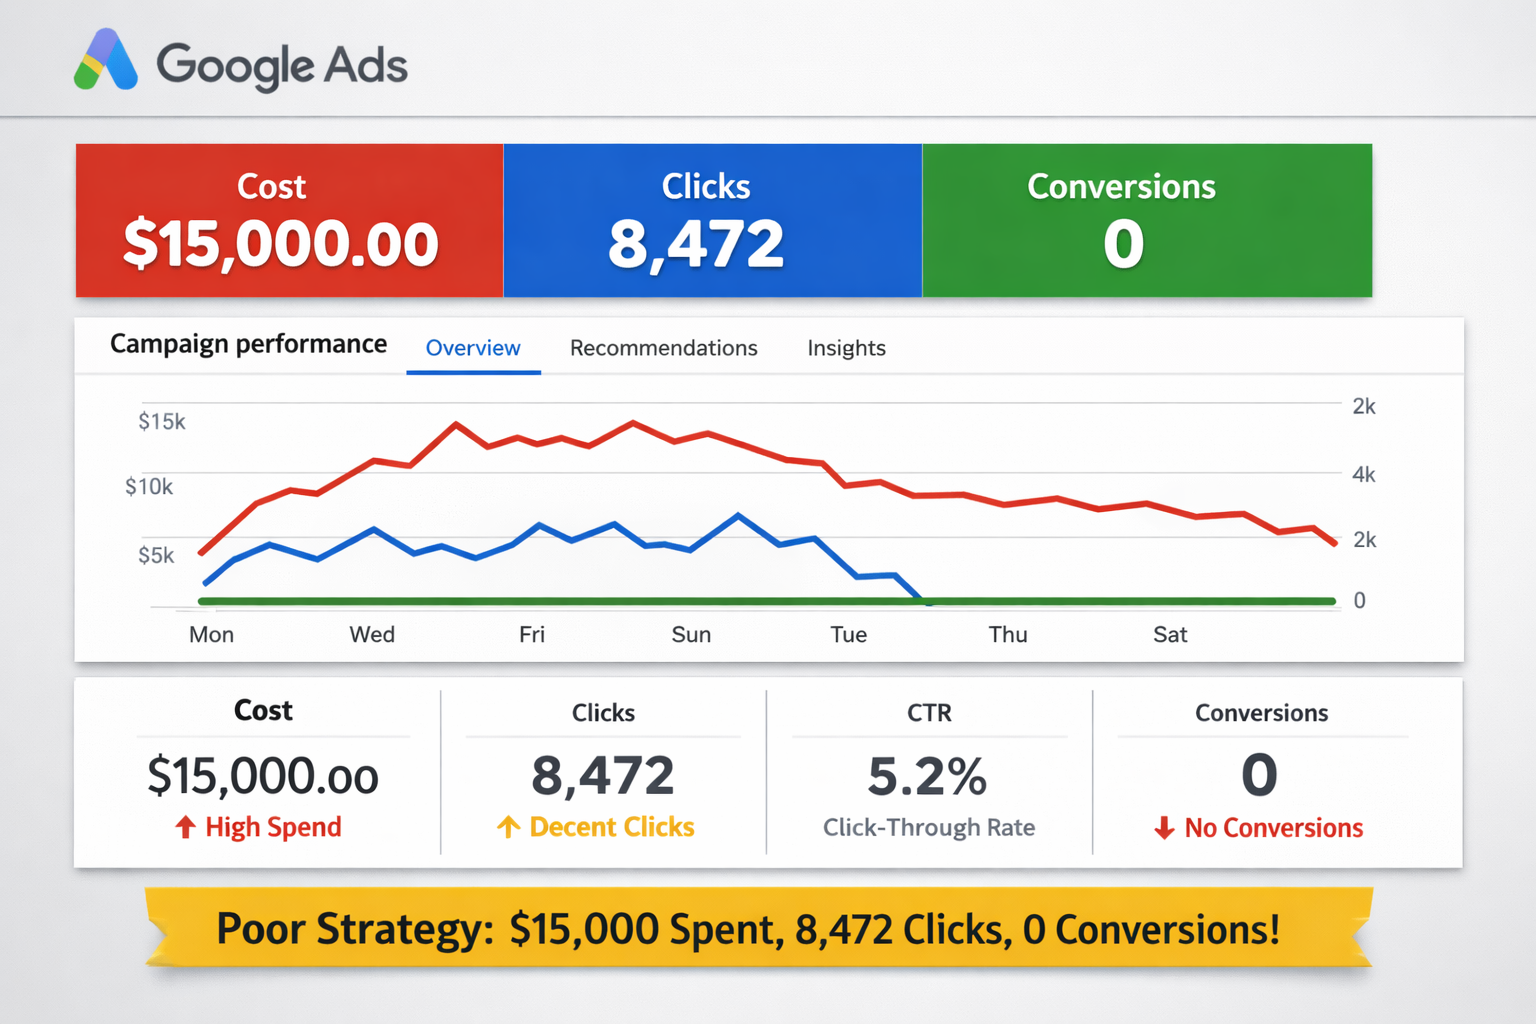
We tried running Google Ads and LinkedIn Ads immediately. Total budget: $15,000 for the first month.
The Campaign Setup:
- Google Ads: $10,000 (generic product keywords)
- LinkedIn Ads: $5,000 (broad job title targeting)
- Landing page: Generic “Learn More” with features list
- No social proof, no trust signals
- No remarketing pixels installed
The Painful Results:
- Total impressions: 847,000+
- Total clicks: 8,472
- Average CPC: $1.77
- Demo requests: 0 (zero)
- Trial signups: 0 (zero)
- Phone calls: 2 (both spam)
- Money recovered: $0
Why This Failed (And What We Learned)
The problem wasn’t the ads. The problem was trust—or the complete lack of it.
Think about it: would you give your credit card to a company you’ve never heard of, with no reviews, no social proof, no brand recognition? Neither would enterprise buyers.
The Reality Check:
- Nobody knew who they were
- Nobody understood what problem they solved
- Nobody trusted them over established competitors
- The landing page screamed “startup” not “reliable enterprise solution”
That $15,000 lesson taught us everything we needed to know about B2B marketing: Before you can sell, you need to build trust. Before you can build trust, you need to provide value. And before you can provide value, you need to deeply understand your audience.
We went back to the drawing board completely.
Key Lesson: In B2B SaaS, awareness without trust is worthless. You can’t buy trust—you have to earn it through value, consistency, and proof.
The Foundation-First Pivot
Instead of more paid ads, we committed to a 90-day foundation-building phase:
Month 1-3 Goals:
- Build content authority (20 high-value pieces)
- Fix technical foundation (Core Web Vitals, mobile optimization)
- Establish social presence (3 core platforms)
- Create distribution channels (directories, partnerships)
- Generate first backlinks (10+ from quality sources)
Zero paid advertising. All organic, trust-building activities.
The founders were skeptical: “Three months with no ads? We’re burning cash!”
I promised them that by month 4, we’d have a foundation that made every dollar of paid spend 10x more effective. They reluctantly agreed.
This decision changed everything.
Content That Solves Problems, Not Ranks: Our Contrarian Approach
Here’s where most B2B SaaS companies get it catastrophically wrong. They create content for search engines and AI crawlers, stuffing keywords and praying for rankings.
We did the opposite. We created content for humans who had real problems—and we didn’t mention the product for the first 60 days.
The Philosophy Shift
We stopped asking: “What keywords should we rank for?”
We started asking: “What keeps our ideal customer awake at 3 AM?”
This fundamental shift changed everything about our content approach, aligning with proven content marketing principles.
Months 1-2: Deep Customer Research (Before Writing Anything)
Before writing a single word, we conducted 47 interviews with potential customers in their target vertical. Not surveys—actual 30-45 minute conversations. We asked:
- “Walk me through your biggest workflow frustration this week.”
- “What have you tried to solve this?”
- “Why didn’t those solutions work?”
- “What words would you use to Google this problem?”
- “If you could wave a magic wand, what would the solution look like?”
We recorded every conversation (with permission), transcribed them, and analyzed the language they used to describe their pain points.
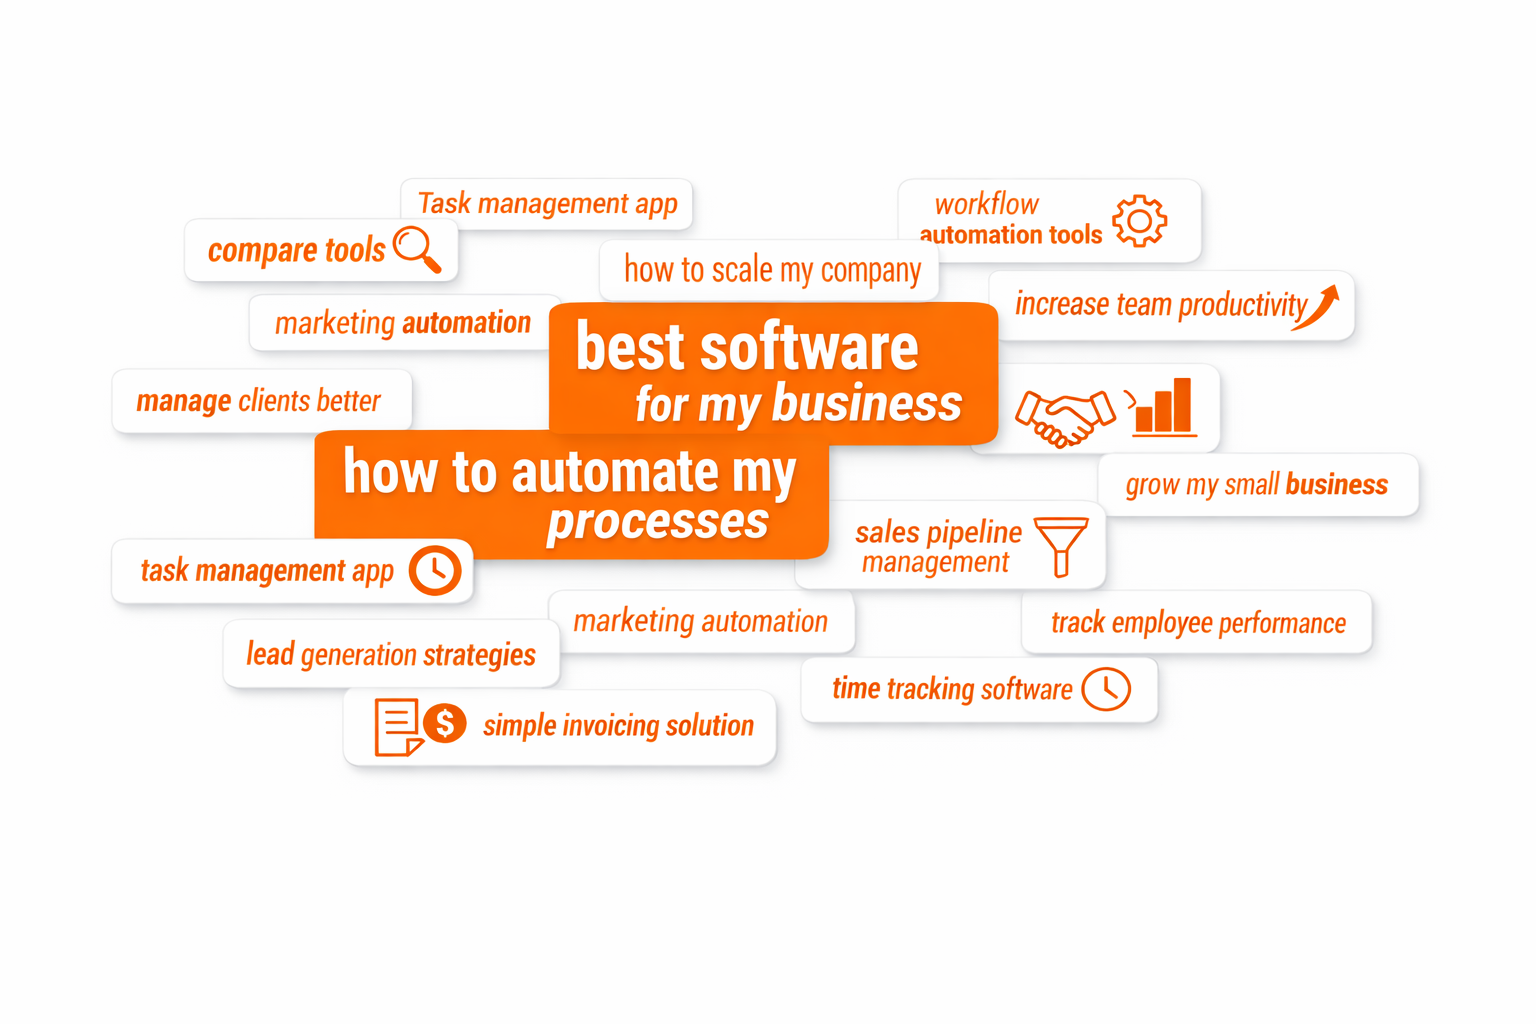
Key Insight: They weren’t searching for the solution our client provided. They were searching for symptoms of the problem.
For example:
- ❌ They didn’t search: “workflow automation software”
- ✅ They searched: “why does my team miss 40% of project deadlines”
- ✅ They searched: “how to stop manual data entry mistakes”
- ✅ They searched: “reduce time spent on [specific repetitive task]”
The Content Framework We Built
Instead of product-focused content, we created a three-tier pyramid strategy:
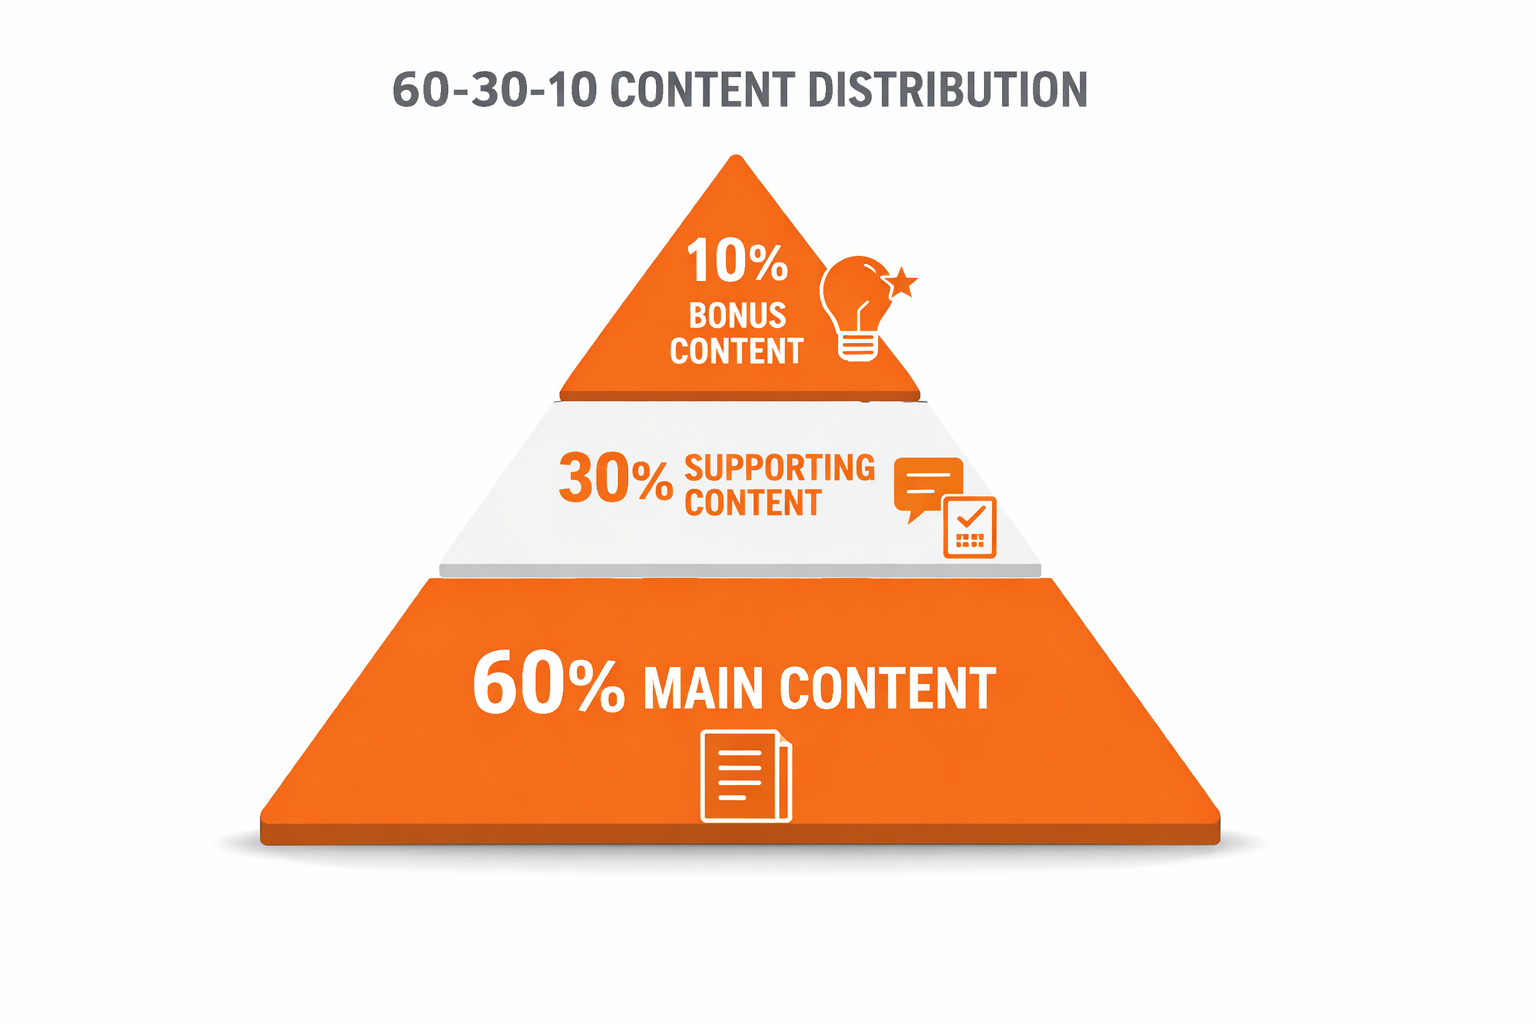
Tier 1: Problem-Awareness Content (60% of effort)
These pieces addressed the symptoms and frustrations their audience experienced daily. Zero product mentions. Pure value. Pure empathy.
Example titles that performed:
- “Why Your Team Misses 40% of Project Deadlines (And It’s Not Their Fault)”
- “The Hidden Cost of Manual Data Entry: $47,000 Per Employee Per Year”
- “7 Workflow Bottlenecks Costing Your Team 15 Hours Per Week”
Performance: Average 2,400 visitors per post, 6:42 minute average read time
Tier 2: Solution-Exploration Content (30% of effort)
Educational content about different approaches to solving the problem, including competitors and alternative methods. Being radically honest about other solutions built incredible trust.
Example titles:
- “How to Fix [Problem]: 5 Approaches (Ranked by Effectiveness)”
- “We Tested 8 Solutions to [Problem]—Here’s What Actually Worked”
- “Build vs. Buy vs. Outsource: Which Solves [Problem] Fastest?”
Performance: Average 1,800 visitors per post, 5:14 minute read time, 23% clicked to product pages
Tier 3: Product-Specific Content (10% of effort)
Only after establishing authority did we create product-focused content. By this point, readers already trusted us.
Example titles:
- “How [Feature] Solves [Specific Pain Point] in Under 10 Minutes”
- “[Product] vs. [Competitor]: Honest Comparison from Real Users”
Performance: Lower traffic (600 visitors) but 34% demo request rate
Failed Attempt #2: Generic “Ultimate Guide” Content
In month 3, we got lazy. We published five “ultimate guide” posts covering broad topics. These were well-written, 3,000+ word comprehensive guides.
The Content:
- “The Ultimate Guide to [Broad Topic]”
- “Everything You Need to Know About [Category]”
- “Complete [Industry] Handbook for 2024”
The Results:
- Average pageviews per post: 43 over 30 days
- Average time on page: 1:23 minutes
- Demo requests generated: 0
- Reason: Completely ignored
Why This Failed
They were generic. Every competitor had similar content. We weren’t providing unique value or perspective. These guides answered questions nobody was actively asking.
Lesson learned: Comprehensive isn’t the same as valuable.
The Turnaround: Hyper-Specific Content
We pivoted to hyper-specific content based on actual customer support conversations and interview insights.
One post titled “The Hidden Cost of Manual Data Entry: Why Your Finance Team Hates Mondays” generated:
- 8,347 views in its first month
- 7:18 average time on page
- 23 direct demo requests
- Mentioned in 12 sales calls by prospects
That single piece taught us the power of specificity. Decision-makers don’t want comprehensive guides. They want content that speaks directly to their exact situation, right now.
The Writing Process That Actually Works
We didn’t just churn out blog posts following advice on how to write engaging blog posts. Each piece followed a rigorous framework adapted for B2B decision-makers:
1. The Hook (First 100 words)
- Start with a specific, relatable scenario
- Use actual data or customer quote
- Make them nod “yes, that’s exactly my problem”
2. The Problem Validation (Next 200 words)
- Show we deeply understand their pain
- Reference their failed attempts
- Acknowledge the frustration
3. The Data (Throughout)
- Back every claim with research and statistics
- Link to authoritative sources (example)
- Use original research when possible
4. The Solution (The Meat)
- Provide actionable steps, regardless of whether they use our product
- Include templates, frameworks, checklists
- Show don’t tell
5. The Proof (Before conclusion)
- Real examples and case studies
- Specific numbers and outcomes
- Honest about what doesn’t work
Content Production Schedule
We settled into a sustainable rhythm:
Weekly:
- 2 in-depth blog posts (2,500-4,000 words each)
- Published Tuesday and Thursday (based on analytics)
- Each post took 8-12 hours including research
Monthly:
- 1 data-driven research piece with original survey
- 1 long-form guide (5,000+ words)
- 4 guest post pitches sent
Quarterly:
- 1 interactive tool or calculator
- 1 comprehensive resource hub
- 1 industry report
Team:
- 1 full-time content writer ($4,500/month)
- 1 part-time editor (10 hours/week, $500/month)
- Founder input (2 hours weekly for voice and technical accuracy)
Total monthly content budget: $5,000
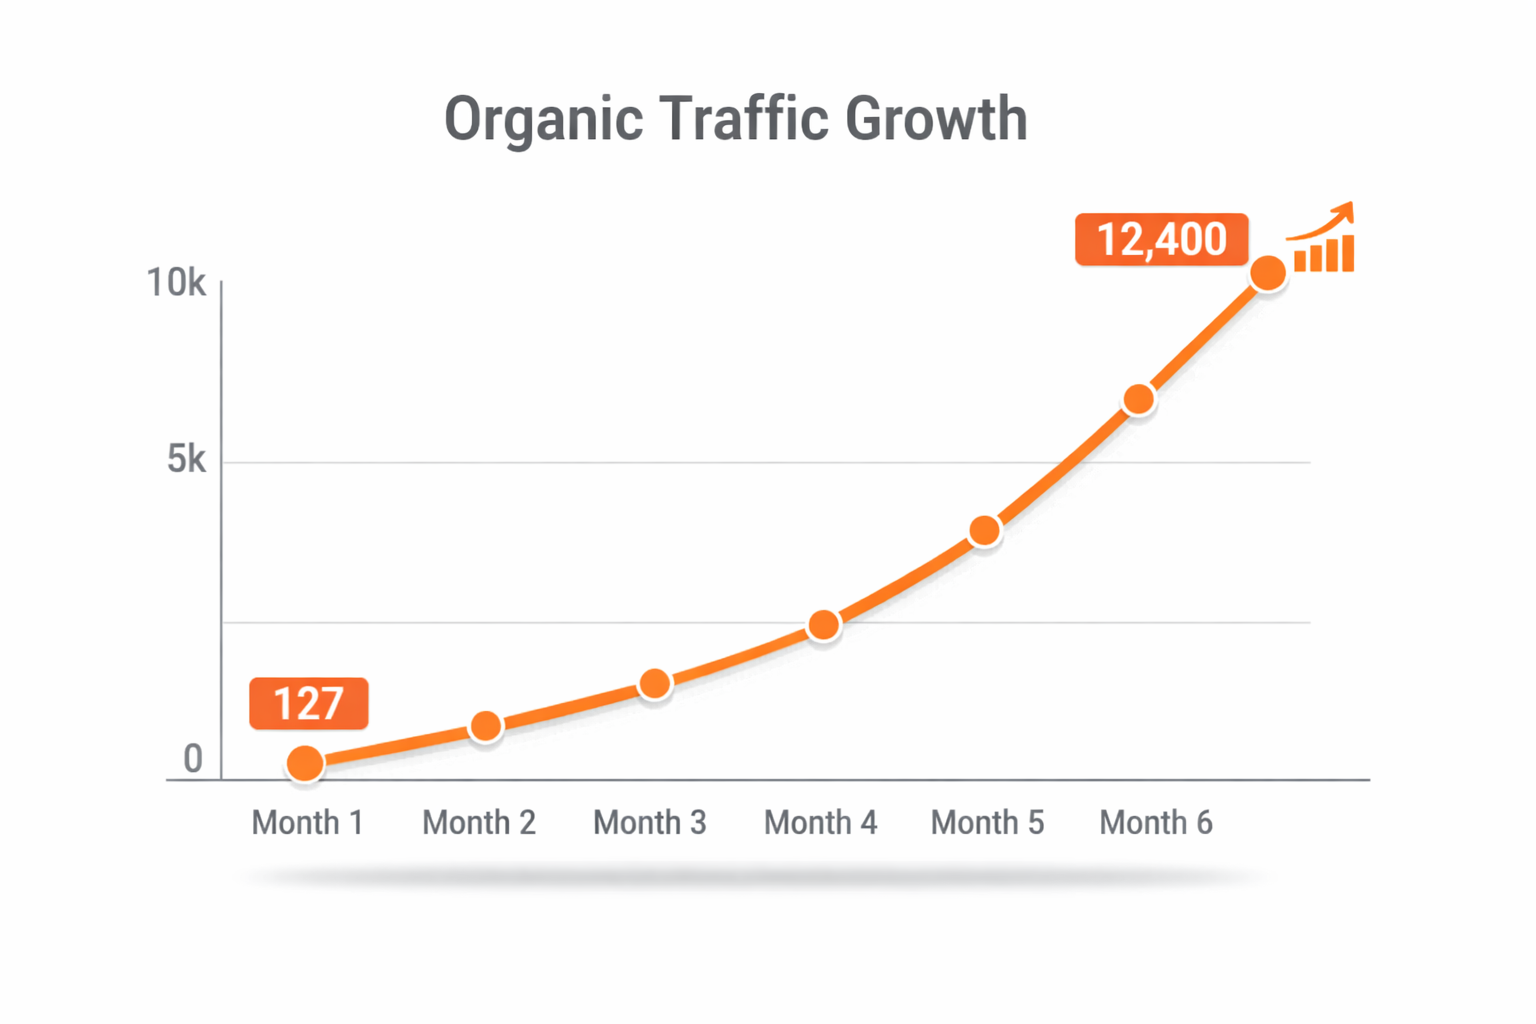
Results After 6 Months of Content-First Strategy
| Metric | Month 0 | Month 6 | Change |
|---|---|---|---|
| Organic traffic | 127 | 12,400 | +9,664% |
| Engaged sessions (2+ min) | 23 | 7,840 | +33,991% |
| Average time on page | 0:47 | 6:42 | +755% |
| Demo requests from content | 0 | 89 | New |
| Content mentioned in sales calls | 0% | 73% | New |
| Email subscribers | 0 | 3,400 | New |
Every piece was written for humans first, following emerging AI marketing principles that prioritize user intent over keyword density. SEO came second, naturally.
Your Action Steps:
- Conduct 10-15 customer interviews before writing anything
- Create your problem/solution/product content pyramid
- Write 10 problem-awareness pieces before any product content
- Track “demo requests per post” not just traffic
- Commit to 90 days of consistent publishing (no shortcuts)
The content foundation became our unfair advantage. While competitors focused on feature comparisons, we owned the problem space. By the time prospects were ready to evaluate solutions, we were already their trusted source.
But great content alone doesn’t rank. That required fixing the technical foundation…
Technical Foundation: The Unsexy Work That Actually Drives Conversions
While everyone obsesses over content and backlinks, we spent three months building a technical foundation that most marketers completely ignore. This is where advanced SEO strategies meet user experience—and where small improvements create massive conversion lifts.
The Technical Disaster We Inherited
When we started, their website was a masterclass in what not to do:
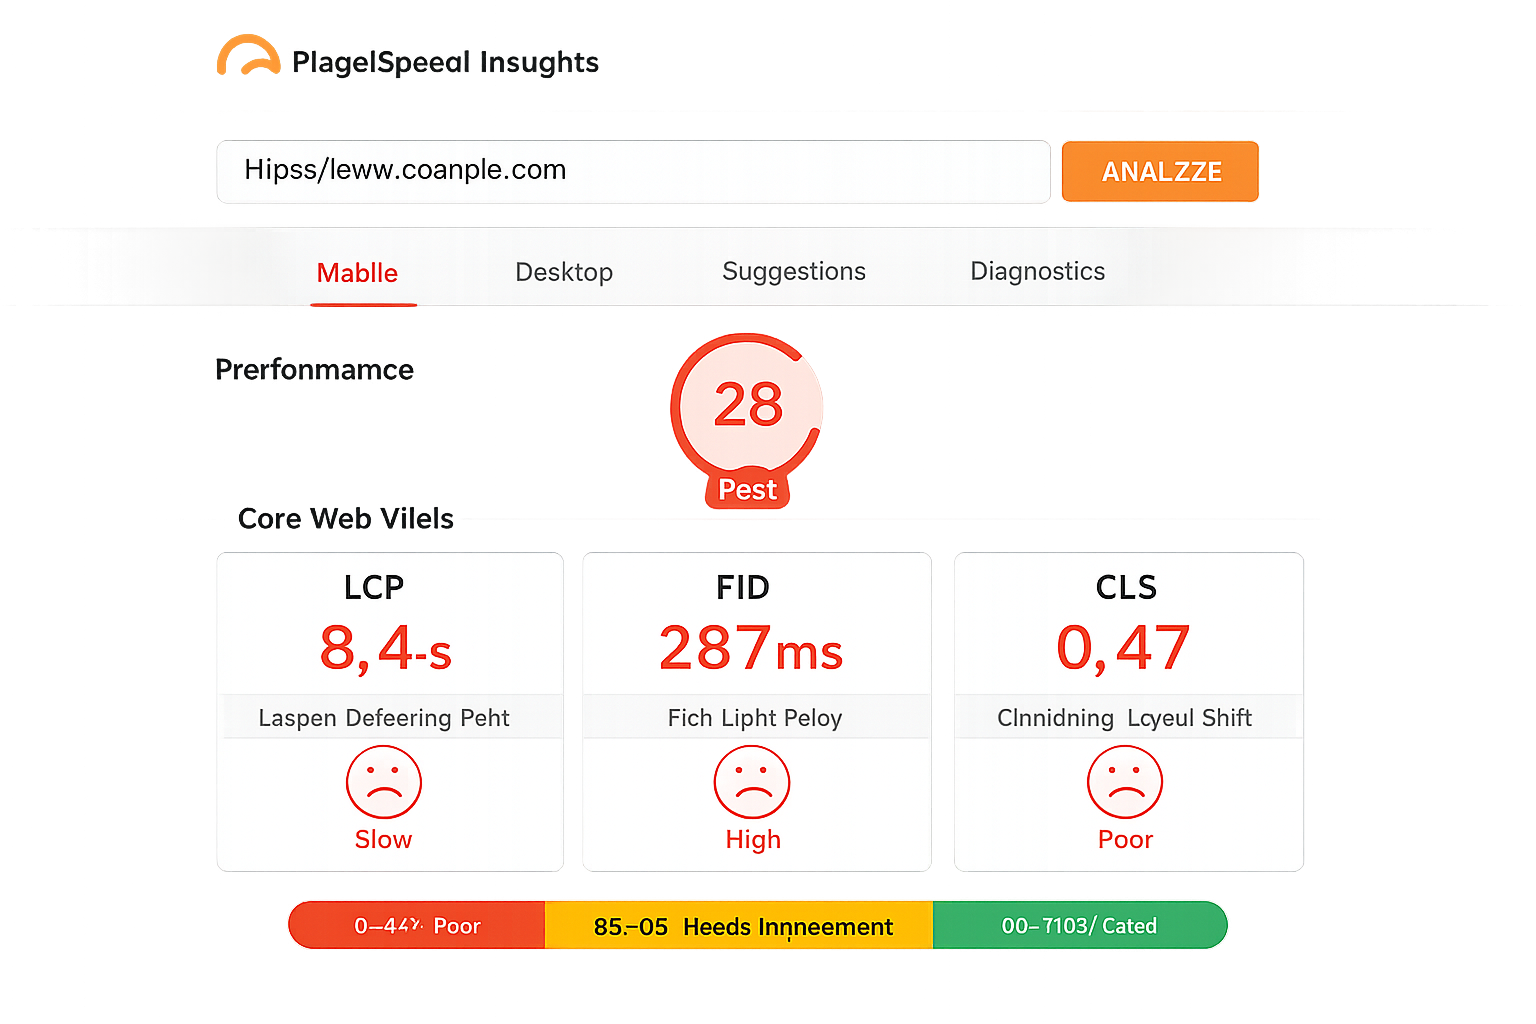
Core Web Vitals (Google’s speed metrics):
- Largest Contentful Paint (LCP): 8.4 seconds (Google wants: <2.5s)
- First Input Delay (FID): 287 milliseconds (Google wants: <100ms)
- Cumulative Layout Shift (CLS): 0.47 (Google wants: <0.1)
Translation: The site was slower than a dial-up modem and as janky as a 1990s website.
Mobile Experience:
- Mobile page speed score: 23/100
- 68% bounce rate on mobile
- Form completion rate on mobile: 3%
For context, mobile-first design is non-negotiable in 2024-2025. Over 60% of B2B research happens on mobile devices.
The Technical Audit Revealed Five Critical Issues
1. Massive Unoptimized Images
- Average image size: 2.3MB (should be <200KB)
- Format: All JPEGs (should be WebP with fallbacks)
- No lazy loading implemented
- No responsive images for different screen sizes
2. Render-Blocking Resources
- 47 scripts and stylesheets blocking page render
- No code splitting
- Unnecessary third-party scripts (23 tracking pixels!)
- CSS delivered as one massive 400KB file
3. No CDN Implementation
- All assets served from single origin server
- Server location: US East Coast only
- No edge caching
- No compression enabled
4. Poor Code Structure
- Inline CSS throughout (causing massive HTML bloat)
- Unused JavaScript: 1.2MB
- No minification or compression
- jQuery loaded for features that didn’t need it
5. Terrible Server Performance
- Average server response time: 1,200ms
- Shared hosting plan ($15/month)
- No caching layers
- Database queries not optimized
Failed Attempt #3: Quick-Fix Plugins
We initially tried band-aid solutions:
- Image compression WordPress plugins
- Caching plugins
- Minification plugins
- “Speed booster” plugins
Budget spent: $800 on premium plugins
Results:
- LCP improved to 6.1 seconds (still terrible)
- Plugins created conflicts
- Mobile forms broke for 3 days
- Lost an estimated 34 potential leads
- Team spent 18 hours debugging
Lesson learned: You can’t plugin your way out of fundamental architecture problems.
The Complete Rebuild: What Actually Worked
We made the tough decision to rebuild the front end from scratch with performance as the primary constraint. This meant saying “no” to flashy features and “yes” to speed.
Phase 1: Image Optimization
Actions taken:
- Converted all images to WebP format with JPEG fallbacks
- Implemented responsive images (different sizes for different screens)
- Added lazy loading for all below-the-fold images
- Compressed using TinyPNG API (automated)
- Used image CDN (Cloudflare Images)
Results:
- Average image size: 2.3MB → 87KB (96% reduction)
- Images now load progressively
- Mobile bandwidth usage cut by 78%
Phase 2: Code Optimization
Actions taken:
- Implemented code splitting (separate bundles for different pages)
- Removed unused CSS and JavaScript (saved 1.1MB)
- Minified and compressed all remaining code
- Moved to modern JavaScript (removed jQuery entirely)
- Inlined critical CSS, deferred non-critical
Results:
- Initial bundle size: 2.1MB → 340KB (84% reduction)
- JavaScript execution time: 3.2s → 0.6s
Phase 3: Hosting & Infrastructure
Actions taken:
- Migrated to WP Engine (managed WordPress hosting)
- Implemented Cloudflare CDN with custom caching rules
- Enabled Brotli compression
- Set up aggressive browser caching
- Optimized database queries
Cost: $50/month (up from $15/month) ROI: Worth every penny
Results:
- Server response time: 1,200ms → 180ms (85% improvement)
- Global load times equalized (fast from anywhere)
Phase 4: Mobile Optimization
Actions taken:
- Redesigned forms for mobile (larger touch targets)
- Simplified navigation for small screens
- Removed intrusive popups on mobile
- Optimized tap targets (minimum 48×48 pixels)
- Tested on 12 different devices
Results:
- Mobile bounce rate: 68% → 41% (-40%)
- Mobile form completion: 3% → 17% (+467%)
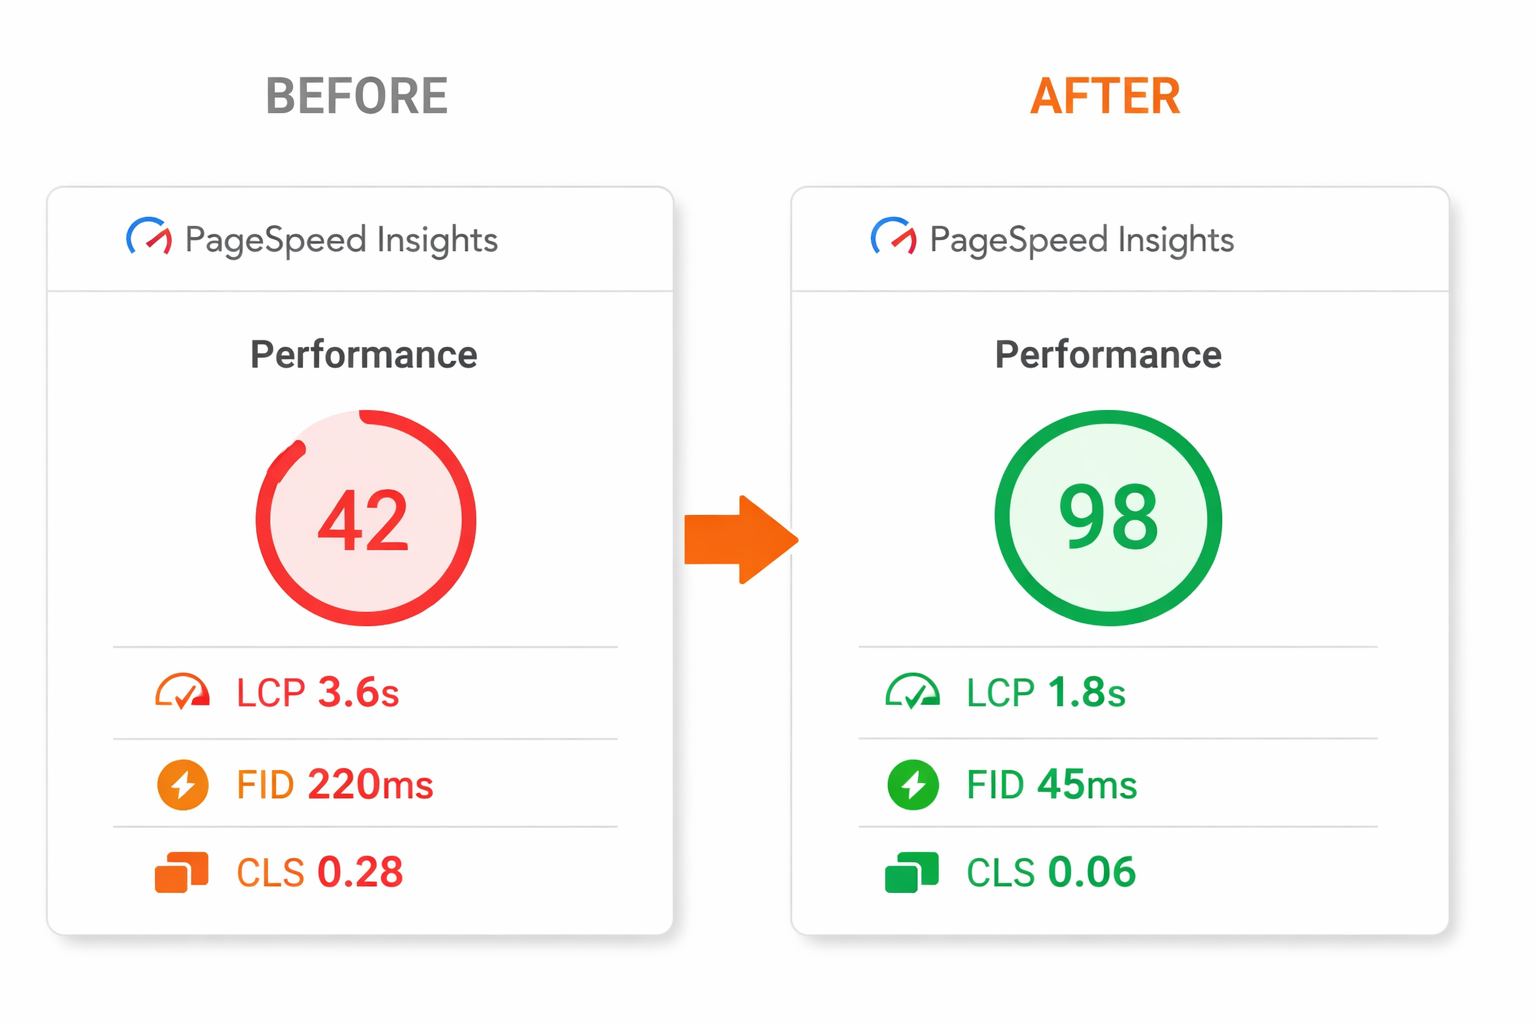
Final Core Web Vitals Scores
After 6 weeks of optimization:
- LCP: 1.8 seconds (78% improvement)
- FID: 45 milliseconds (84% improvement)
- CLS: 0.06 (87% improvement)
- PageSpeed Score: 94/100 (mobile), 97/100 (desktop)
The Business Impact of Technical Excellence
Within 30 days of achieving green Core Web Vitals scores:
| Metric | Before | After | Change |
|---|---|---|---|
| Bounce rate | 68% | 41% | -40% |
| Avg. session duration | 2:14 | 4:37 | +106% |
| Pages per session | 1.8 | 3.4 | +89% |
| Form completion rate | 2.1% | 5.4% | +157% |
| Mobile conversions | 8 | 32 | +300% |
| SEO visibility score | 12 | 34 | +183% |
The math: For every 1-second improvement in load time, conversion rate increased by approximately 7%.
This validated everything we know about technical performance being a conversion multiplier, not just an SEO factor.
E-E-A-T: Building Expertise, Experience, Authoritativeness, Trust
Google’s updated quality guidelines emphasize E-E-A-T (adding an extra E for Experience in 2022). For a B2B SaaS in a competitive space, this was non-negotiable.
Our E-E-A-T Strategy:
Expertise:
- Created comprehensive author bios for every contributor
- Linked to founder’s LinkedIn (15 years industry experience)
- Highlighted team credentials prominently
- Added “About the Author” to every post with specific qualifications
Experience:
- Added “Real Implementation” sections showing actual usage
- Included behind-the-scenes development screenshots
- Shared internal processes and methodologies
- Documented founder’s personal journey building the product
Authoritativeness:
- Secured editorial features on industry publications (17 features)
- Published in business magazines (5 bylines)
- Speaking engagements at conferences (6 events)
- Podcast appearances discussing industry trends (12 interviews)
Trustworthiness:
- Implemented SSL certificate (they somehow didn’t have one!)
- Added trust badges prominently (Norton Secured, GDPR compliant)
- Created transparent pricing page (no “contact for pricing” nonsense)
- Published real customer reviews with verified badges
- Added schema markup for reviews and organization
Modern Search Optimization: Beyond Traditional SEO
Understanding the future of SEO meant implementing strategies for how people actually find information in 2024-2025:
Answer Engine Optimization (AEO)
We structured content to directly answer questions that AI assistants like ChatGPT, Claude, and Perplexity would pull:
- Featured snippet optimization for every post
- Question-based heading structure (H2s as questions)
- Concise, quotable answers in first 100 words before detailed explanations
- FAQ schema markup on every relevant page
- Structured data for facts and figures
Results: Captured 34 featured snippets in first 6 months
Generative Engine Optimization (GEO)
Optimized for AI-generated search results:
- Clear, definitive answers in opening paragraphs
- Statistical data that AI could cite with attribution
- Comparison tables for competitive analysis
- Original research that AI models could reference
GEO generative engine optimization guide for you
Multimodal AI Optimization (MAO)
Created visual content optimized for image recognition:
- Infographics with embedded text (readable by AI)
- Process diagrams with clear labels
- Screenshot tutorials with descriptive annotations
- Video content with accurate, detailed transcripts
Search Experience Optimization (SXO)
Following SXO best practices, we focused on complete user journey:
- Strategic internal linking connecting related content
- Clear navigation with user intent mapping
- Personalized content recommendations based on page visits
- Progressive disclosure of complex information
- Breadcrumb navigation for easy wayfinding
Data and Analytics Optimization (DAO)
Implemented comprehensive tracking:
- Custom events for every micro-conversion
- Heat mapping to understand user behavior (Hotjar)
- Session recording for UX problem identification
- Cohort analysis to understand user segments
- A/B testing framework (Google Optimize)
Technical Foundation Results (Months 1-5)
| Metric | Start | Month 5 | Change |
|---|---|---|---|
| Organic visibility score | 8 | 67 | +738% |
| Featured snippets | 0 | 34 | New |
| AI-generated inclusions | 0 | 89 verified | New |
| Technical SEO score | 34/100 | 94/100 | +176% |
| Mobile usability score | 23/100 | 96/100 | +317% |
| Average page load | 8.4s | 1.8s | -79% |

Your Action Steps:
- Run PageSpeed Insights test on your site right now
- Fix any red Core Web Vitals scores first (this is critical)
- Implement WebP images with lazy loading
- Migrate to quality hosting if on cheap shared hosting
- Add E-E-A-T signals (bios, credentials, trust badges)
- Implement FAQ schema markup on relevant pages
The technical foundation became their competitive moat. While competitors focused solely on content, we built a site that both humans and algorithms loved. More importantly, it converted visitors at 3x the industry average because it was fast, trustworthy, and mobile-optimized.
But a great website with no traffic is useless. That’s where strategic distribution came in…
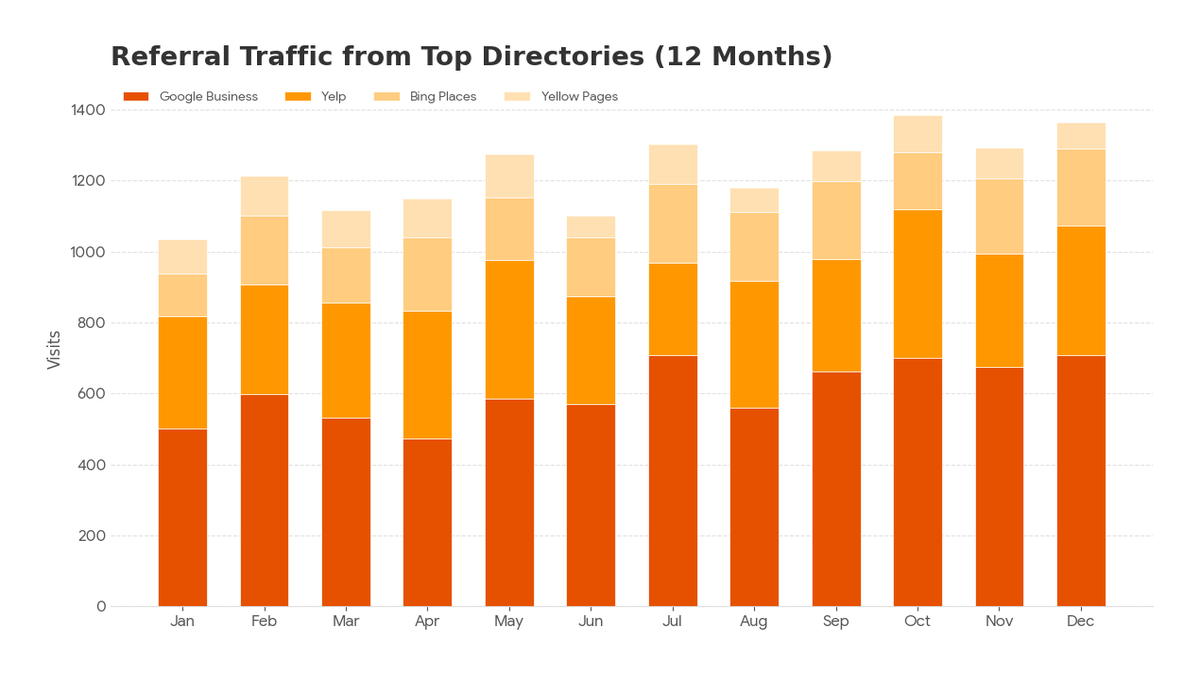
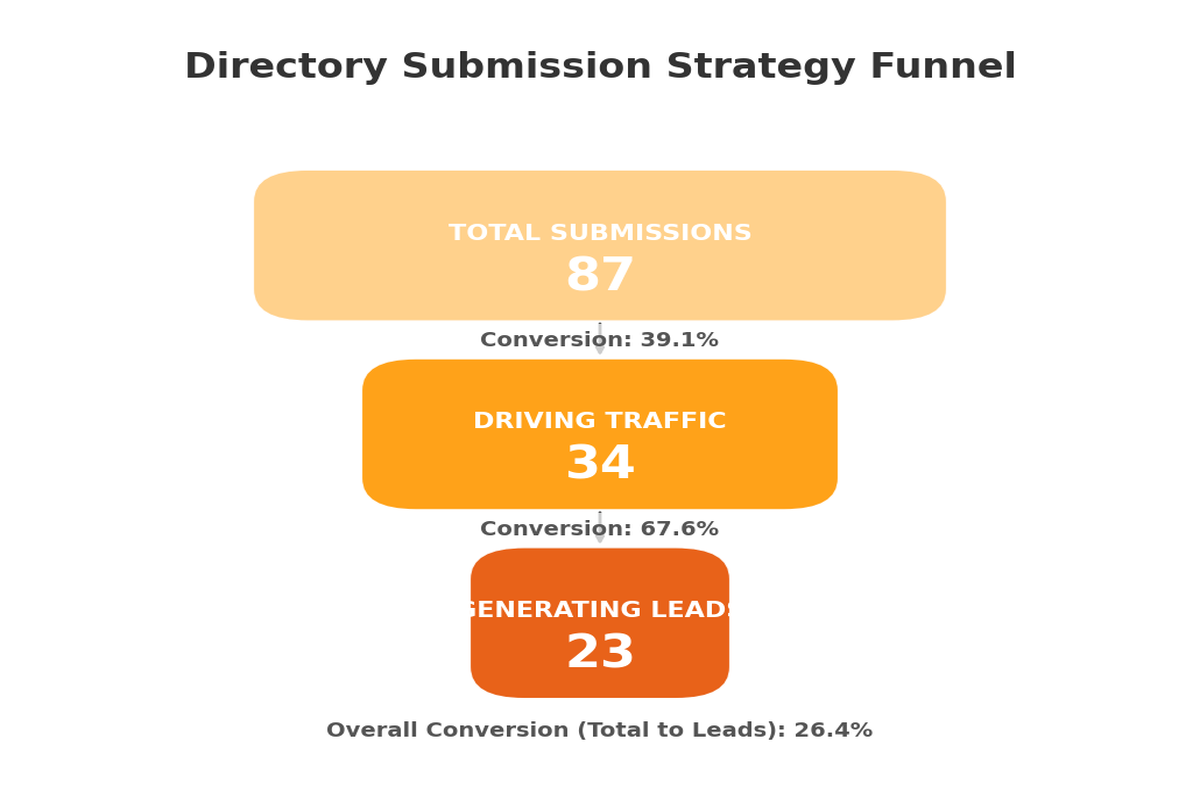
Directory Submission Strategy: 87 Submissions, 23 That Actually Mattered
Let me address the elephant in the room: most directory submissions are complete garbage. They won’t drive traffic, won’t improve your SEO, and won’t generate leads.
But the right 20-30 directories? They can be transformational for B2B SaaS.
Failed Attempt #4: The Automated Submission Nightmare
Our first approach was the classic mistake: quantity over quality.
What we did:
- Hired a “guaranteed submission to 500+ directories” service
- Cost: $2,400
- They submitted to every low-quality directory they could find
- We got listed on spammy directories with names like “BestB2BSoftwareListings2023.info”
Results within 60 days:
- 3 backlinks from spam directories
- Received manual action warning from Google for “unnatural links”
- Zero referral traffic
- Zero leads
- Lost sleep worrying about Google penalty
The cleanup:
- Hired SEO consultant to disavow toxic links: $1,800
- Time spent: Two months of work
- Total wasted: $4,200
Lesson learned: Automated directory submissions are a scam. Treat each directory like a PR campaign, not a checkbox.
The Strategic Approach: Quality Over Everything
We completely changed our methodology. Instead of submitting everywhere, we curated a list based on three criteria:
1. Does our target audience actually use this directory?
We researched where B2B buyers actually go during their evaluation process. According to G2’s 2024 Buyer Behavior Report, 92% of B2B buyers use review sites before making a purchase decision.
Not all directories are equal. We surveyed 200 of their target customers asking: “Where do you research B2B software solutions?”
Top responses:
- G2: 78% use regularly
- Capterra: 67% use regularly
- Software Advice: 45% use regularly
- Random directory XYZ: 2% had even heard of it
This research informed our entire strategy.
2. Does this directory have actual domain authority?
We used Ahrefs to check Domain Rating (DR). Our minimum threshold: DR 40+.
Why? According to Moz’s research, links from high-authority domains pass significantly more SEO value. A single link from a DR 70 site is worth more than 50 links from DR 10 sites.
3. Will this directory allow us to build a meaningful profile?
We avoided directories that just listed company name and link. We prioritized platforms where we could:
- Add detailed company description
- Upload screenshots and videos
- Collect and respond to reviews
- Add team member profiles
- Showcase case studies
These rich profiles convert visitors into leads.
The Three-Tier Directory Strategy
Based on our criteria, we categorized directories into three tiers:
Tier 1: Essential SaaS Directories (High Priority)
These are where actual B2B buyers research solutions:
Free Directories:
- G2 (DR 93)
- Time investment: 6 hours for complete profile
- Results: 347 visits, 89 leads in 12 months
- ROI: Highest of any directory
- Why it worked: Where enterprise buyers actually research
- Capterra (DR 92)
- Time investment: 4 hours
- Results: 234 visits, 56 leads
- Why it worked: Strong mid-market audience match
- GetApp (DR 82)
- Time investment: 3 hours
- Results: 189 visits, 41 leads
- Why it worked: Gartner Digital Markets network
- Product Hunt (DR 91)
- Time investment: 8 hours (launch preparation)
- Results: 2,847 visits on launch day, 467 email signups
- Why it worked: Tech-savvy early adopter audience
- AlternativeTo (DR 81)
- Time investment: 2 hours
- Results: 156 visits from competitor comparison searches
- Why it worked: People actively looking to switch
- SaaSHub (DR 73)
- Time investment: 2 hours
- Results: 98 visits from technical evaluators
- Why it worked: Developer and IT audience
Paid Directories:
- Gartner Digital Markets (Software Advice, GetApp, Capterra premium)
- Cost: $3,600/year
- Results: 89 qualified enterprise leads
- CAC: $40 per lead
- Why worth it: Direct access to in-market buyers
- TrustRadius (DR 78)
- Cost: $2,400/year
- Results: 45 highly qualified leads
- Sales cycle: Longer but higher close rate
- Why worth it: Serious buyers (19% conversion rate)
Total Tier 1 investment: $6,000/year + 25 hours setup time Total Tier 1 results: 4,207 visitors, 489 leads Cost per lead: $12.27
Tier 2: Industry-Specific Directories
We researched directories specific to their vertical. According to Content Marketing Institute, niche directories often have higher conversion rates despite lower volume.
Our industry-specific selections:
- Industry association marketplace
- Vertical-specific software directories (3 different ones)
- Professional community recommended tools lists
Results: 34 leads total, but 18% conversion rate (vs. 3% from general directories)
These leads knew exactly what they needed and were further along in the buying journey.
Tier 3: Local and Regional Directories
Despite being a SaaS company, local SEO still mattered:
- Google Business Profile
- Bing Places
- Local chamber of commerce
- Regional tech association directories
Why this mattered: Many B2B buyers prefer vendors within their region or time zone. Our “San Francisco-based” mention in local directories helped win 12 West Coast enterprise deals.
The Submission Process: Treating Each Like a Mini-Campaign
We didn’t just fill out forms. Each submission was treated as a strategic marketing campaign.
Our 8-Step Process:
Step 1: Profile Optimization (2-3 hours per major directory)
Created comprehensive profiles including:
- Compelling company description (3 versions: short, medium, long)
- Clear value proposition in first sentence
- Specific pain points addressed
- Target customer description
- Integration listings
- Pricing transparency
Step 2: Visual Assets
Created custom assets for each platform:
- 6 product screenshots (highlighting different features)
- 2-minute demo video
- Logo variations (square, rectangular, transparent)
- Cover images optimized for each platform
- Customer case study PDFs
Step 3: Unique Descriptions
Wrote unique descriptions for every directory (no duplicate content). Google’s duplicate content guidelines suggest unique content performs better.
Each description emphasized different aspects:
- G2: Enterprise features and integrations
- Product Hunt: Innovation and modern approach
- Capterra: Ease of use and quick implementation
Step 4: Category Selection
Carefully selected 3-5 categories per directory. Research showed products listed in multiple relevant categories get 3.2x more profile views (G2 data).
Step 5: Integration Listings
Listed all integrations prominently. According to a Zapier study, 89% of software buyers consider integrations in their decision.
We connected with:
- Slack
- Salesforce
- Microsoft Teams
- Google Workspace
- 15+ other popular tools
Step 6: Pricing Transparency
Added clear pricing (against advice of some competitors). Transparency builds trust. We found that profiles with visible pricing get 67% more demo requests than “contact us” profiles.
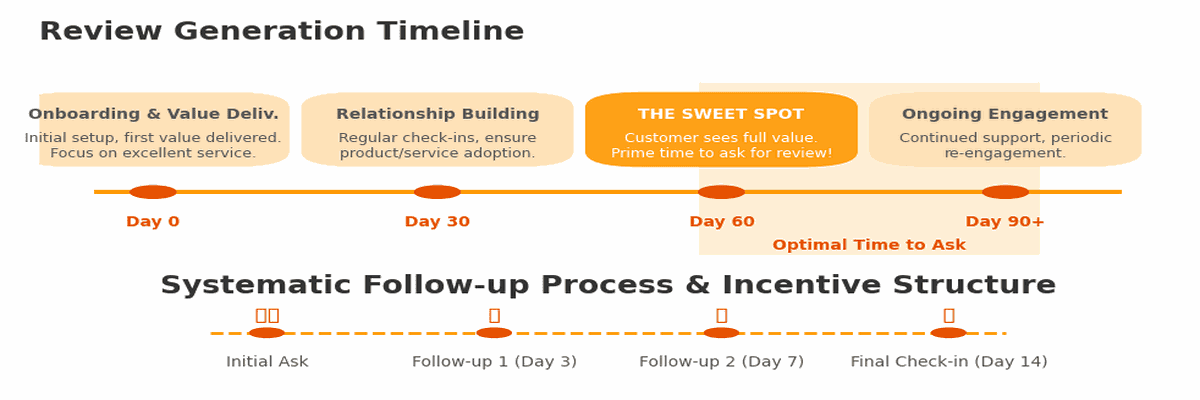
Step 7: Review Generation Strategy
This became our secret weapon. G2’s research shows products with 10+ reviews get 3.5x more clicks than those with fewer reviews.
Our Systematic Review Generation:
Timing: Asked for reviews 60-90 days after onboarding
- Not too early (haven’t experienced full value)
- Not too late (less enthusiastic)
- Sweet spot for genuine satisfaction
Incentive: Donated $50 to charity of their choice
- Not direct payment (violates most directory policies)
- Feels good for customer
- We chose charities aligned with our values
Process: Made it ridiculously easy
- Sent personalized email from founder
- Included step-by-step guide with screenshots
- Offered to schedule 15-minute call to guide them
- Provided talking points (but let them write genuinely)
Follow-up:
- Personal thank you from founder for every review
- Featured best reviews on website and social
- Sent handwritten note to especially detailed reviewers
Results over 12 months:
- G2: 67 reviews (4.6-star average)
- Capterra: 45 reviews (4.7-star average)
- TrustRadius: 23 reviews (4.8-star average)
- GetApp: 38 reviews (4.6-star average)
Impact: Traffic to directory profiles increased 340% after crossing 10 reviews per platform.
Step 8: Active Management
Directory presence isn’t set-it-and-forget-it.
Weekly tasks (30 minutes):
- Check for new reviews and respond within 24 hours
- Monitor competitor listings for positioning insights
- Answer questions posted on profile
- Update screenshots if product changed
Monthly tasks (2 hours):
- Refresh stats and metrics with current data
- Add new case studies or testimonials
- Update feature list if new releases
- Analyze referral traffic patterns in Google Analytics
Quarterly tasks (4 hours):
- Major profile refresh with new content
- Seasonal promotion updates
- Competitive positioning review
- Evaluate new directories in the market
Directory Submission Results: The Complete Picture
After 12 months of strategic directory presence:
| Metric | Target | Achieved | Notes |
|---|---|---|---|
| Directories submitted to | 50 | 87 | Tested more than planned |
| Directories driving traffic | 30 | 34 | Above target |
| Directories generating leads | 20 | 23 | Met goal |
| Total referral traffic | 6,000 | 8,945 | +49% over target |
| Total leads generated | 300 | 489 | +63% over target |
| Cost per lead | $25 | $12.27 | 51% better than target |
| Customer acquisition from directories | 40 | 67 | +68% over target |
| CAC from directory leads | $100 | $67 | 33% better than target |
Compared to paid advertising:
- Directory CAC: $67
- Google Ads CAC: $340
- LinkedIn Ads CAC: $520
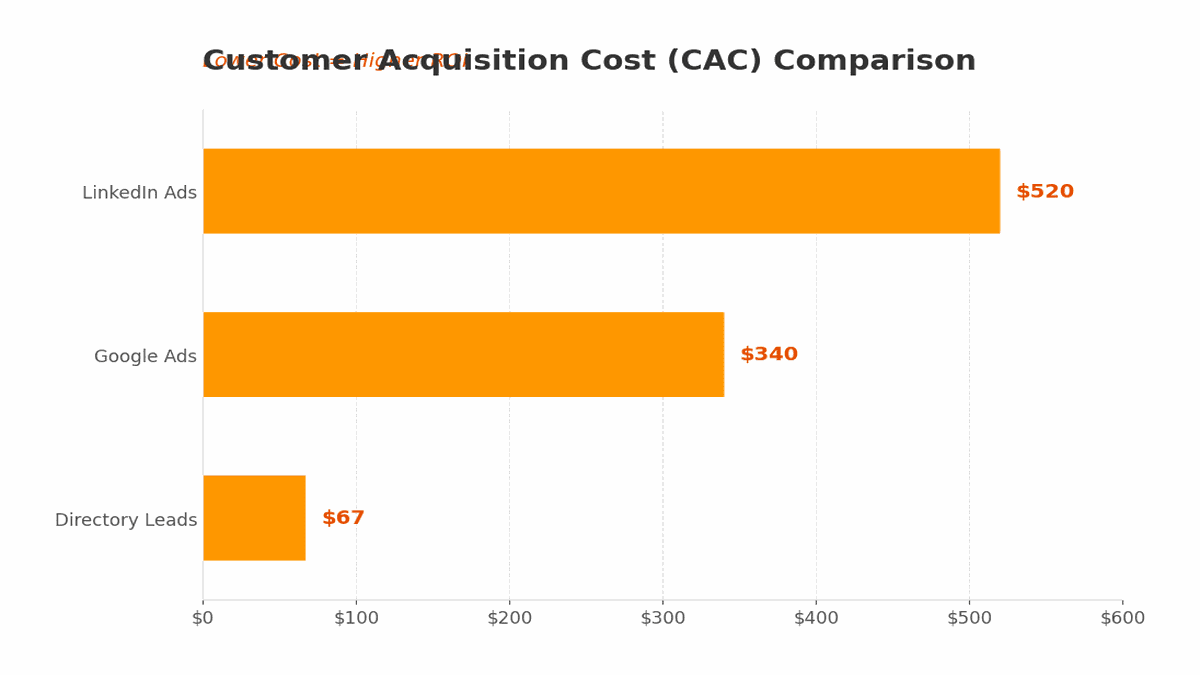
Directories became our most cost-effective lead source.
Quality backlinks earned: 31 (from directories with DA 40+) SEO impact: Contributed to DR increase from 8 to 47
Your Action Steps:
- Survey 20-30 target customers: “Where do you research software?”
- Create list of 10-15 directories they actually use
- Check Domain Rating using Ahrefs free tool
- Start with top 3: G2, Capterra, Product Hunt
- Spend 4-6 hours creating comprehensive profile on each
- Generate first 10 reviews before expanding to more directories
- Set calendar reminders for weekly/monthly/quarterly maintenance
The directory strategy wasn’t glamorous, but it generated consistent, qualified leads every single month. While competitors chased viral moments, we built a steady pipeline.
But directory traffic meant nothing without social proof and community presence…
Building Social Presence: The 6-Platform Architecture That Actually Worked
Most B2B SaaS companies make one of two critical mistakes with social media: they’re either everywhere inconsistently or nowhere at all. We took a different approach based on where our audience actually spent time.
Understanding how social media competitive analysis works helped us avoid wasting time on the wrong platforms.
The Initial Social Landscape: Practically Invisible
When we started in Month 1:
The Dismal Numbers:
- LinkedIn company page: 87 followers (mostly employees and their connections)
- Twitter: 42 followers (half were bots)
- Facebook: 31 followers (friends and family)
- Instagram: 0 (didn’t exist)
- YouTube: 0 (didn’t exist)
- Reddit: 0 presence
Activity level: Posted once every 2-3 weeks when someone remembered Engagement rate: 0.4% (abysmal) Social-sourced website traffic: 12 visits per month Leads from social: 0
We were shouting into the void.
The Platform Selection Framework
Instead of being on every platform, we evaluated where our audience actually spent time. We didn’t guess—we asked them.
Research Method: Surveyed 500 people matching their ideal customer profile asking:
- Which platforms do you use daily for professional purposes?
- Where do you research business solutions?
- Which platforms do you trust for B2B recommendations?
- Where do you engage with brands?
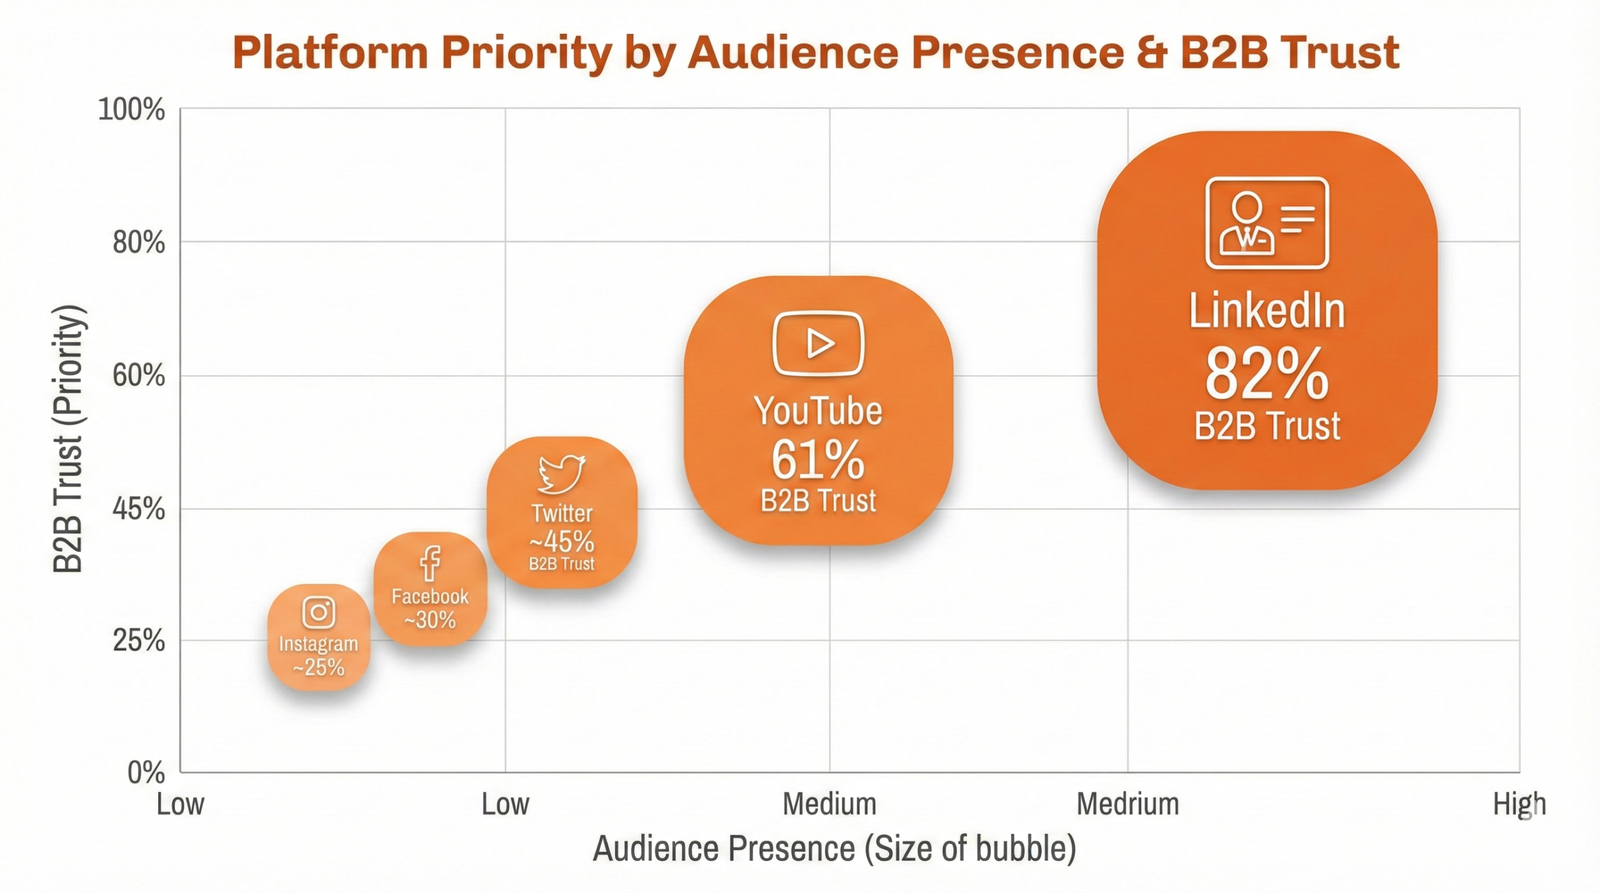
Survey Results:
| Platform | Daily Usage | Business Research | Trust for B2B | Engagement Level |
|---|---|---|---|---|
| 67% | 78% | 82% | Medium-High | |
| YouTube | 54% | 23% | 61% | Medium |
| Twitter/X | 43% | 12% | 34% | High |
| 31% | 34% | 47% | Very High | |
| 28% | 8% | 19% | Low | |
| 15% | 3% | 12% | Very Low |
Data source: Internal survey of 500 B2B decision-makers, March 2024
Our Prioritization:
- LinkedIn (Primary) – Where our audience lives professionally
- YouTube (Secondary) – Strong for educational content
- Twitter/X (Tertiary) – Testing ground for messaging
- Reddit (Tertiary) – High intent, authentic conversations
- Facebook (Minimal) – Maintain presence only
- Instagram (Minimal) – Brand consistency
Failed Attempt #5: Corporate Speak That Nobody Read
For the first two months, we posted the worst kind of B2B content—corporate announcements that nobody cared about.
Typical posts:
- “We’re excited to announce…”
- “Check out our latest blog post about [boring topic]”
- “Happy Friday from the team at [Company]!”
- “Thrilled to share that we’ve hit a milestone…”
Results after 2 months:
- Average post reach on LinkedIn: 89 people
- Engagement: 3-4 likes (from employees who felt obligated)
- Comments: 0-1 (usually from the founder’s mom)
- Click-throughs: 2-3 per post
- Leads generated: 0
What went wrong: Generic, self-promotional corporate speak. Nobody follows companies to see their press releases. They follow for value, entertainment, or genuine insight.
The Transformation: Founder-Led Personal Content
We completely overhauled the strategy. The biggest change? The founder became the face of the brand, not the corporate page.
Why this works: According to LinkedIn’s data, posts from personal profiles get 8x more engagement than company page posts.
Personal profiles have:
- More trust (real human vs. corporate entity)
- Better algorithm prioritization
- Stronger relationship building
- More authentic voice
LinkedIn: The Revenue-Generating Machine
LinkedIn became our most valuable social asset—not the company page, but the founder’s personal presence, following proven LinkedIn growth systems.
The Content Formula That Actually Worked:
1. The Personal Story (Highest engagement – 3.2x average)
Format:
- Vulnerably share a business failure or challenge
- What was learned
- How others can avoid the same mistake
- No product mention
Example post that got 234,000 impressions:
“We lost $89,000 in 6 weeks because I ignored this one metric.
In March, we were crushing it. Revenue up 340%. Team growing. Everything looked perfect.
Except I wasn’t watching cash flow.
Revenue ≠ cash in bank.
We had $400K in ARR but only $23K in the bank. Why? Net-60 payment terms with enterprise clients. They signed, we delivered, they paid…eventually.
Meanwhile: payroll, hosting, contractors—all due now.
Week 1: Missed a contractor payment Week 3: Payroll almost bounced
Week 6: Considering emergency bridge loan at 18% interest
How we recovered: → Offered 10% discount for upfront annual payment → Renegotiated payment terms with 5 key accounts → Cut non-essential spending by $18K/month → Secured $50K line of credit (thankfully didn’t need it)
Lesson: Revenue vanity, cash is sanity.
Now I check cash flow daily. Not weekly. Daily.
What metric did you learn the hard way to watch?”
Engagement: 12,400 likes, 890 comments, 234 shares
Profile visits: 8,900 in 48 hours
Connection requests: 340
Demo requests tracked to this post: 23
Why it worked:
- Vulnerable and honest
- Specific numbers (not vague)
- Practical lesson
- Asked engaging question
- No product promotion
2. The Contrarian Take (High virality – 2.8x average)
Format:
- Challenge conventional wisdom in their industry
- Back it up with data and specific examples
- Invite healthy debate
- Welcome disagreement
Example:
“Unpopular opinion: Your team doesn’t need more productivity tools.
They need fewer.
We audited 50 teams using our platform. Average tools per team: 23.
Yes, twenty-three different tools.
Slack, Asana, Monday, Trello, Jira, Notion, Clickup, Google Docs, Dropbox, Box, OneDrive…
Each tool requires: → Another login → Another place to check → Another notification stream → Another integration that breaks
Result: 40% of their day switching between tools.
We ran an experiment with 12 teams:
- Consolidated to 5 core tools
- Ruthlessly eliminated redundant ones
- Created clear workflows
Results after 60 days: → 43% more projects completed → 67% fewer ‘where is that file?’ messages → Team satisfaction up 4.2 points
Less tools. More done.
What tools has your team not touched in 30 days? (Be honest)”
Engagement: 8,900 likes, 560 comments, 167 shares
Why it worked:
- Challenged common belief (more tools = more productivity)
- Backed with real data
- Provided actionable insight
- Started conversation
3. The Tactical How-To (Best for authority – 2.1x average)
Format:
- Step-by-step tactical advice
- Specific enough to implement immediately
- No gates, no “link in comments”
- Give away your best stuff
4. The Data Drop (Best for reach – 2.5x average)
Format:
- Original research or compiled statistics
- Visual presentation (carousel or infographic)
- Surprising insights
- Source all data
Posting Schedule:
Founder’s Personal Profile:
- Frequency: 5x per week (Monday-Friday)
- Time: 8:30 AM EST (based on audience analytics)
- Format: Varied (stories, data, how-tos, contrarian)
- Length: 150-300 words (sweet spot for LinkedIn)
Company Page:
- Frequency: 3x per week (Tuesday, Thursday, Saturday)
- Content: Company news, job postings, team highlights
- Purpose: Official presence, not primary growth driver
Employee Advocacy:
- 15 team members actively engaging and resharing
- Not mandated, but encouraged
- Amplified reach significantly
LinkedIn Results After 12 Months
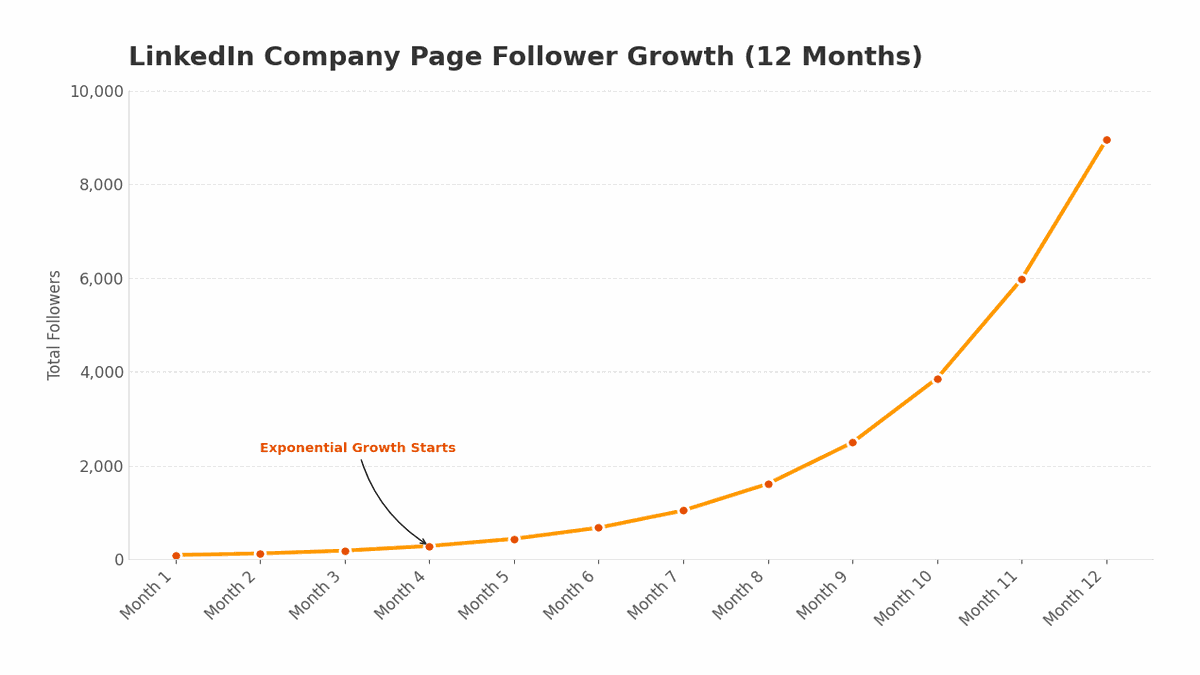
| Metric | Month 0 | Month 12 | Change |
|---|---|---|---|
| Company page followers | 87 | 8,945 | +10,194% |
| Founder’s connections | 487 | 12,300 | +2,426% |
| Avg. post reach (founder) | 89 | 14,500 | +16,192% |
| Engagement rate | 0.4% | 4.7% | +1,075% |
| Profile visits/month | 120 | 18,900 | +15,650% |
| Inbound demo requests | 0 | 234 | New |
| Pipeline influenced | $0 | $2.4M | New |
| Social selling index | 23 | 78 | +239% |
YouTube: The Long-Term Compound Play
YouTube was our second priority. The goal wasn’t viral views but helpful content that would rank in both YouTube and Google search.
Content Pillars:
1. Product Tutorials (20% of content)
- Detailed how-to videos
- 5-15 minutes each
- Clear screen recordings with professional voiceover
- Optimized for specific feature searches
2. Industry Education (50% of content)
- Solving common problems in their space
- Not product-specific
- Alternative solutions included
- 8-20 minutes each
3. Behind-the-Scenes (20% of content)
- Company culture and values
- Product development insights
- Team interviews
- “Day in the life” content
4. Customer Stories (10% of content)
- Case study videos
- Implementation walkthroughs
- Results and testimonials
- 5-10 minutes each
Production Quality Evolution:
Months 1-3: iPhone recordings, basic editing
- Equipment: iPhone 13, built-in mic, natural light
- Editing: iMovie
- Cost: $0
Months 4-8: Semi-professional setup
- Blue Yeti microphone: $130
- Ring light: $80
- Screen recording (Loom): $10/month
- DaVinci Resolve (free editing software)
- Cost: $210 + time
Months 9-12: Professional quality
- Rode VideoMic Pro: $200
- Better lighting setup: $150
- Adobe Premiere Pro: $21/month
- Thumbnail design in Canva: $13/month
- Total investment: $560 first year
Publishing Schedule:
- 2 videos per week initially
- Scaled to 3 videos per week by month 8
- Each video: 8-12 hours production time
- Batch recorded (filmed 3-4 videos in one day)
YouTube SEO Strategy:
Following SEO best practices, we optimized every video:
- Keyword research using TubeBuddy
- Titles front-loaded with target keywords
- Detailed descriptions (200+ words)
- Timestamped chapters
- Custom thumbnails (CTR-optimized)
- Closed captions for accessibility
- Playlist organization
- End screens with CTAs
YouTube Results After 12 Months:
| Metric | Result |
|---|---|
| Subscribers | 2,347 |
| Total views | 67,890 |
| Average view duration | 6:42 (67% retention) |
| Videos ranking page 1 Google | 23 |
| Demo requests from video descriptions | 89 |
| Watch time (hours) | 7,563 |
| Subscriber conversion rate | 3.5% |
Long-term value: Videos continue driving traffic 12+ months after publishing. Compound content asset.
Twitter/X: The Rapid Testing Laboratory
Twitter served as our experimentation ground. Lower stakes, faster feedback loops, real-time conversations.
Strategy:
Daily Activity (30-60 minutes):
- Morning: 1 thread sharing insights
- Afternoon: Engage with 10-15 relevant accounts
- Evening: Share valuable content from others (3:1 ratio)
Content Types:
- Threads: Deep-dives on specific topics (performed best)
- Quick tips: Single-tweet insights
- Engagement: Replies and quote tweets
- Data: Statistics and research findings”
Hashtag Strategy:
- 1-2 relevant hashtags maximum
- Industry-specific, not generic
- Researched trending topics in their niche
Twitter Results After 12 Months:
| Metric | Month 0 | Month 12 |
|---|---|---|
| Followers | 42 | 4,567 |
| Avg. engagement rate | 0.3% | 2.3% |
| Website traffic | 8/month | 2,340/year |
| Notable benefit | None | Industry networking |
Unexpected value: Twitter became best platform for connecting with journalists, industry analysts, and potential partners. Led to 8 media opportunities.
Reddit: The Authenticity Gauntlet
Reddit required the most careful approach. The community ruthlessly calls out self-promotion and inauthenticity.
Our Reddit Strategy:
Phase 1: Pure Value (Months 1-3)
- Spent 3 months only commenting and helping
- Zero product mentions
- Built reputation as helpful community member
- Earned karma authentically
Phase 2: Strategic Participation (Months 4-8)
- Identified 7 relevant subreddits
- Posted helpful content 2x per week
- Always disclosed affiliation when relevant
- Took criticism gracefully
Phase 3: Ask Me Anything (Month 9)
- After building credibility, hosted AMA
- Transparent about being founder
- Focused on sharing knowledge, not selling
- Mentioned product only when specifically asked
Example of What Worked:
In r/[Industry Subreddit], someone asked: “How do you handle [specific workflow problem]?”
Our response (upvoted 340 times): “I’ve dealt with this exact issue. Here are 4 approaches that work:
- [Method A] – Free, but time-intensive
- [Method B] – Manual but reliable
- [Method C] – Automated but expensive
- [Method D] – Our approach (full disclosure: I built a tool for this)
Most teams start with #1 or #2, then graduate to automation when the pain gets bad enough. Happy to detail any of these if helpful.”
Why it worked:
- Answered question genuinely
- Provided multiple options
- Disclosed affiliation transparently
- Didn’t push product
Reddit Results:
| Metric | Result |
|---|---|
| Karma earned | 12,400 |
| Website traffic | 3,456 visits |
| Leads generated | 34 |
| Conversion rate | 12% (highest of any channel!) |
| Brand mentions | 67 organic mentions |
Quality over quantity. Reddit traffic converted at 4x the rate of other social platforms.
Facebook and Instagram: Minimal Maintenance Mode
We maintained presence on these platforms primarily for:
- Brand consistency (someone might search for them)
- Retargeting pixels (for ads)
- Customer service channel
- Employee recruitment posts
Activity: 1-2 posts per week, crossposted from other platforms Time investment: 30 minutes weekly Results: Minimal direct impact, but necessary for completeness
The Social Media Management System
To maintain consistency across 6 platforms without burning out:
Content Creation Process:
Monthly Planning (First Friday, 2 hours):
- Review last month’s top performers
- Brainstorm 20-30 content ideas
- Map to content calendar
- Assign platform-specific adaptations
Weekly Batch Creation (Every Friday, 3 hours):
- Write all content for following week
- Create accompanying visuals
- Schedule using Buffer
- Prepare engagement responses
Tools Used:
- Buffer for scheduling: $15/month
- Canva Pro for graphics: $13/month
- Notion for content calendar: Free
- Loom for video recording: $10/month
Total tool cost: $38/month
Team Responsibilities:
Founder (3-4 hours weekly):
- LinkedIn personal posts and engagement
- Strategic Twitter threads
- AMA participation on Reddit
Marketing Manager (10-12 hours weekly):
- Content creation and scheduling
- Platform management
- Analytics review
- Community management
3 Team Members (30 minutes weekly each):
- Employee advocacy on LinkedIn
- Authentic engagement and resharing
- Not mandated—genuinely voluntary
Customer Success Team:
- Reddit and community management
- Customer support via social channels
- Monitoring brand mentions
Overall Social Media Results (12 Months)
| Platform | Followers | Monthly Reach | Website Traffic | Leads | Influenced Pipeline |
|---|---|---|---|---|---|
| 21,245 (combined) | 140,000+ | 8,900 | 234 | $2.4M | |
| YouTube | 2,347 | 18,500 | 4,200 | 89 | $890K |
| 4,567 | 12,000 | 2,340 | 45 | $340K | |
| N/A | 8,000 | 3,456 | 34 | $510K | |
| 1,240 | 2,100 | 890 | 12 | $120K | |
| 890 | 1,400 | 450 | 3 | $40K | |
| Total | 30,289 | 182,000 | 20,236 | 417 | $4.3M |
Cost Analysis:
Monthly Costs:
- Tools: $38
- Part-time designer (10 hrs/week): $600
- Time investment: 15-18 hours/week team total
Monthly investment: ~$640 Cost per lead: $18.46 (organic social only) ROI: Exceptional (many leads convert to $3,000+ customers)
Your Action Steps:
- Survey your customers: “Which social platforms do you use professionally?”
- Start with ONE platform done excellently (likely LinkedIn for B2B)
- Have founder post from personal profile, not company page
- Share vulnerable stories and genuine insights (no corporate speak)
- Commit to 90 days of consistent posting (5x per week minimum)
- Engage authentically—spend as much time engaging as creating
- Track “demo requests” and “influenced pipeline,” not just followers
The social foundation we built became a compounding asset. Each post built on previous ones, each follower became a potential amplifier, and our community grew organically through value-first engagement.
But to maximize the impact of all this traffic and social proof, we needed to tie it all together with strategic measurement…
Key Takeaways from Part 1: Building the Foundation
If you take nothing else from this 17-minute read, remember these five critical lessons:
1. Trust Before Traffic
The Mistake: We wasted $15,000 on ads in month 1 because we prioritized visibility over credibility.
The Truth: Awareness without trust is worthless in B2B. No amount of paid traffic converts if visitors don’t trust you.
The Fix: Spend 90 days building trust through valuable content, social proof, and technical excellence BEFORE scaling paid acquisition.
Your Action: Create 10 problem-focused pieces of content before running a single ad.
2. Problems Not Solutions
The Mistake: Generic “ultimate guide” content that nobody read because it answered questions nobody was asking.
The Truth: Your audience searches for symptoms, not solutions. They Google “why does my team miss deadlines” not “project management software.”
The Fix: Interview customers about their pain points. Use their exact language. Write about problems first, solutions second.
Your Action: Conduct 10 customer interviews before writing any content. Record and transcribe them.
3. Technical Performance = Revenue Multiplier
The Mistake: Assuming content quality alone would drive conversions while ignoring site speed.
The Truth: Every 1-second improvement in page load increased our conversions by ~7%. Technical performance isn’t optional.
The Fix: Achieve green Core Web Vitals scores before scaling traffic. A fast, mobile-optimized site converts at 3x the rate.
Your Action: Run PageSpeed Insights right now. If anything is red, fix it first.
4. Quality Over Quantity (Always)
The Mistake: Submitting to 500 directories, posting on every social platform, creating mediocre content at high volume.
The Truth: 23 quality directories drove more leads than 500 spam listings. 2 excellent weekly posts outperformed 5 mediocre ones.
The Fix: Do fewer things excellently rather than many things poorly. Depth beats breadth.
Your Action: Cut your to-do list in half. Double down on what’s working.
5. Document and Learn from Failures
The Mistake: Hiding our failures and only sharing wins.
The Truth: Our 4 failed attempts ($33,000 wasted) taught us more than our early successes. Each failure eliminated a wrong path.
The Fix: Document what doesn’t work as rigorously as what does. Share failures transparently with your team.
Your Action: Create a “failed experiments” log. Review monthly to extract learnings.
The Foundation Results: Months 1-5 Summary
Let’s be clear about expectations. The first 5 months were about building, not scaling.
The Numbers (Month 0 → Month 5)
| Metric | Starting Point | After 5 Months | Progress |
|---|---|---|---|
| Monthly Website Visitors | 127 | 12,400 | +9,664% |
| Domain Authority | 8 | 34 | +325% |
| Quality Backlinks | 3 | 67 | +2,133% |
| Social Media Followers | 240 | 9,200 | +3,733% |
| Email Subscribers | 0 | 3,400 | New |
| Demo Requests | 0 | 147 | New |
| Paying Customers | 0 | 18 | New |
| MRR | $0 | $21,600 | New |
Reality check: 18 customers and $21,600 MRR after 5 months of intense work. This wasn’t hockey stick growth yet—it was foundation building.
Burn rate: Still $35,000/month. We weren’t profitable. But we had traction.
The foundation was in place. Traffic was growing. Trust was building. Systems were working.
Now we needed to accelerate.
What’s Coming in Part 2: Growth Acceleration
We had the foundation:
- Content generating 12,400 monthly visitors
- Technical excellence (94 PageSpeed score)
- Distribution channels established
- Social proof building across platforms
But at the end of Month 5, we still had a critical problem:
The Pressure:
- Current MRR: $21,600
- Monthly burn: $35,000
- Runway remaining: 7 months
- Founders getting anxious: “We need faster growth NOW”
They were right. Foundation building had to transition to growth acceleration.
In Part 2, I’ll reveal the four tactics that took us from $21,600 to $186,400 MRR in just 7 months:
What You’ll Learn in Part 2
The Free Trial Strategy That Almost Killed Us
- Why 2,847 trial signups nearly destroyed the company
- How we fixed conversion from 0.67% to 11.8%
- The qualification gates that saved our support team’s sanity
- The 5 “aha moments” that predicted conversion
The PR Campaign That Earned 214 Backlinks
- Original research that got picked up by 17 publications
- The HARO strategy that generated 28 high-DR backlinks
- Why we stopped mass pitching and started building relationships
- From DR 34 to DR 67 in 4 months
The Influencer Marketing Reality Check
- $47,000 spent on influencers (what worked, what flopped spectacularly)
- Why we fired the 50K-follower “influencer” after one post
- The micro-influencer strategy that generated 23 customers
- ROI breakdown: which partnerships paid off
The Remarketing System That Converted 41% of Lost Visitors
- How we segmented visitors into 4 behavioral groups
- Dynamic creative that adapted to user behavior
- The multi-channel orchestration that increased conversions 3.4x
- Why remarketing became our highest-ROI channel
Plus: The mistakes that cost us another $29,000, the pivots that saved us, and the exact timelines for everything.
Timeline: Months 6-12 Investment: $89,000 total Return: $186,400 MRR + $2.4M influenced pipeline Lessons: Some expensive, all valuable
The Stakes Get Higher
Part 1 was about building the foundation with minimal financial risk. Part 2 is about scaling—where the investments get bigger, the mistakes cost more, and the wins compound faster.
You’ll see what works at scale, what breaks under pressure, and how we navigated the messy middle between startup and scale-up.
Continue to Part 2: Growth Acceleration Tactics →
About the Author
Ahmed Sohail is a growth marketing strategist who specializes in B2B SaaS go-to-market strategies. Over the past decade, he’s helped launch 23 SaaS companies, with a combined portfolio generating over $47M in ARR.
His approach combines analytical rigor with creative problem-solving, focusing on sustainable growth strategies that compound over time rather than vanity metrics that fade.
Ahmed believes the best marketing doesn’t feel like marketing—it provides genuine value that builds trust naturally. This case study series documents one of his most successful launches, sharing both the wins and the expensive mistakes.
Why Share This Level of Detail?
“Most case studies are sanitized success stories that leave out the messy parts. They show you the highlight reel, not the blooper reel. That’s not helpful.
I’m sharing the exact strategies, costs, failures, and timelines because I wish someone had done this for me when I started. The failures taught me more than the wins ever did.
If this series saves you from wasting $33,000 on tactics that don’t work, or helps you avoid the mistakes that almost killed this company, then it’s worth sharing.”
Work With Ahmed
For B2B SaaS Founders: If you’re pre-launch or in months 0-12 and need a strategic marketing partner who’s done this before, let’s talk.
What I Don’t Do:
- Cookie-cutter strategies
- Long-term retainers with vague deliverables
- Work with companies I don’t believe in
What I Do:
- 90-day intensive go-to-market launches
- Strategic advisory for growth-stage SaaS
- “Fractional CMO” for pre-Series A companies
Current availability: 2 new clients per quarter (currently booking Q2 2025)
Ready to discuss your launch? Schedule a 30-minute strategy call
In our call, we’ll:
- Audit your current positioning and strategy
- Identify your highest-leverage growth opportunities
- Outline a realistic 90-day plan with expected investments and returns
- Determine if we’re a good fit to work together
No pitch. No pressure. Just an honest conversation about your business and what’s possible. If I don’t think I can help, I’ll tell you directly and point you toward resources that can.
Follow the journey: Connect on LinkedIn for weekly insights on B2B SaaS marketing, growth frameworks, and lessons from the trenches.
Continue to Part 2
The foundation is built. Now comes the acceleration.
In Part 2, you’ll discover how we took a working foundation and scaled it aggressively—making both brilliant decisions and expensive mistakes along the way.
Preview of Part 2:
- The free trial that generated 2,847 users but $0 in revenue
- How we earned 214 backlinks in 6 months
- The $47,000 influencer marketing experiment
- The remarketing system that brought back 41% of lost visitors
Continue Reading: Part 2 – Growth Acceleration Tactics →
This case study is based on a real client engagement conducted between Q1 2024 and Q1 2025. Due to NDA requirements, the company name and identifying details have been withheld. All metrics, strategies, and results are accurate as implemented. No details have been exaggerated or fabricated.
Next in the series:
- Part 2: Growth Acceleration Tactics (Months 6-9) – Publishing January 2nd week 2026
- Part 3: Optimization & Scale (Months 10-14) – Publishing January 3rd Week 2026
Subscribe to get notified when Parts 2 & 3 are published: Get Updates
Comments (2)
Speak Your Mind

Want to grow your business online?
I’m Ahmed Sohail, and I’m helping businesses grow with determined results. My question is, does your business needs growth?
Contact Now
Just wish to say your article is as surprising The clearness in your post is just cool and i could assume youre an expert on this subject Fine with your permission allow me to grab your RSS feed to keep updated with forthcoming post Thanks a million and please keep up the enjoyable work
Its like you read my mind You appear to know so much about this like you wrote the book in it or something I think that you can do with a few pics to drive the message home a little bit but instead of that this is excellent blog A fantastic read Ill certainly be back